PDF version of this document


To get meaningful plots, where error bars faithfully reflect on truth, we ought to better understand our error sources. They appear to be independent, but this observation does not simplify matters.
Let us look at the plots vertically, taking one value of mean pixel
displacement at a time. Each value of displacement, denoted by ![]() ,
is produced by warping a set of aligned images, i.e. images where
there is no inherent displacement.
,
is produced by warping a set of aligned images, i.e. images where
there is no inherent displacement.
Let us define ![]() to be the predicted error in the estimate
of
to be the predicted error in the estimate
of ![]() for a warp instance
for a warp instance ![]() . We can then obtain the mean
. We can then obtain the mean
and the standard error is thus
The above error simply tells us the certainty we have in our values of Specificity, Generalisability, or overlap, averaged over 10 instantiations.
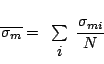
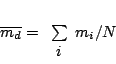
As for the mean of the measurement ![]() for the given displacement
value
for the given displacement
value ![]() ,
,
and the corresponding standard error
This error corresponds to the effect of having 10 different values measured for a given extent of displacement. The values tend to fluctuate slightly, thereby leading to uncertainty. This uncertainty is separate, however, from that which is associated with the computation of the measure itself.