 PDF version of this document
From the above, the corresponding errors can now be derived:
The equation should be expanded to become
and then reduced to
which corresponds to the method of propagating errors in the case of division (see Web link below).
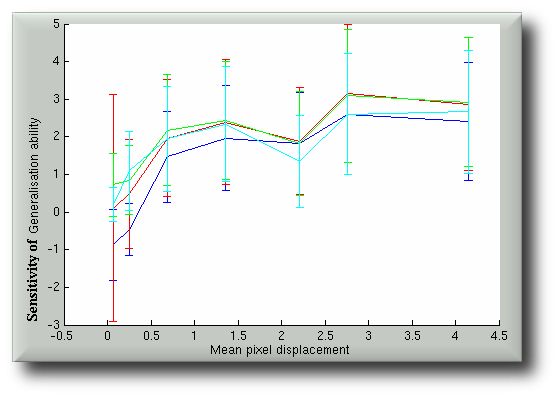
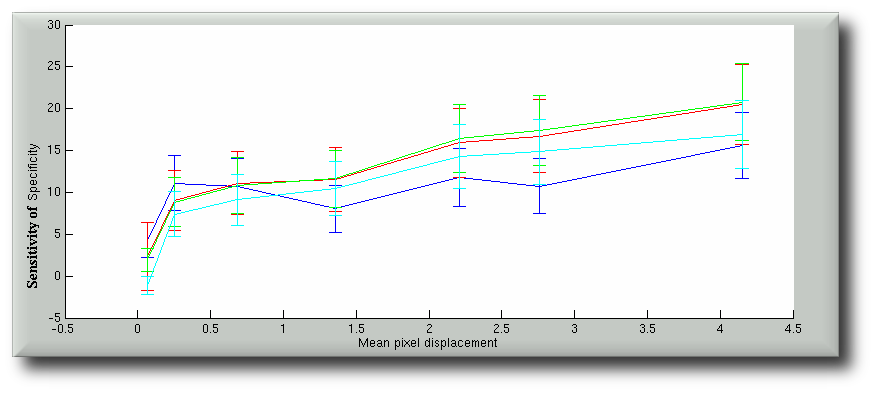
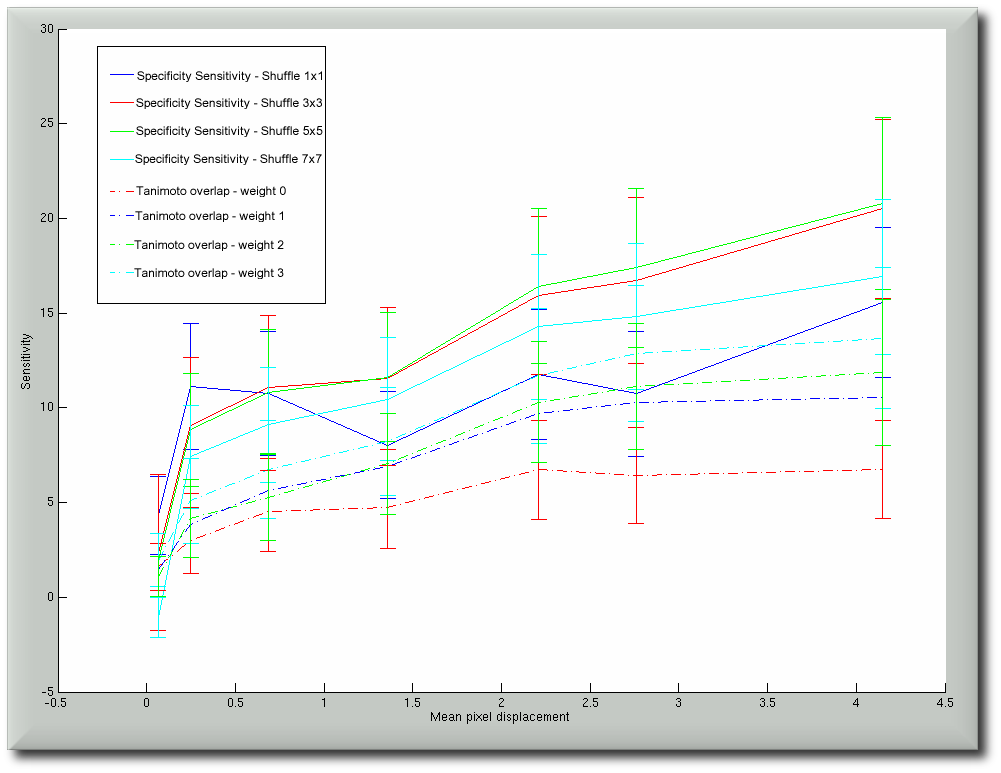
Finally, some figures of sensitivity can be generated. They can either be plotted apart or blended for comparison purposes.


At the last stage, we seek to aggregate the sensitivities by accumulating their values. The corresponding error bars must be propagated properly in accordance with rules of error propagation for addition.
Since in our case particular case, 8 values1 are being aggregated, we retain a running sum and at each point re-calculate
the error bars. The process can be expressed mathematically as follows:
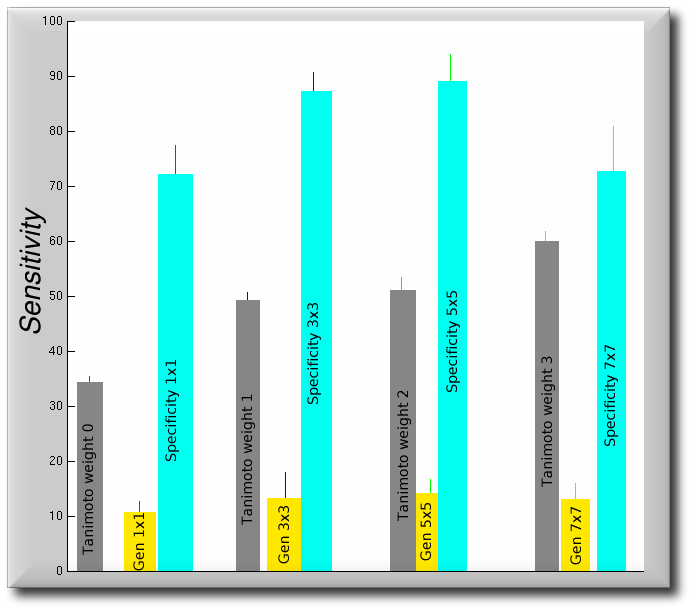
This given an initial (very coarse) figure that serves as somewhat of a benchmark for our methods. This benchmark, however, is tightly-dependent on the hypothesis that sensitivity, as we decided to formulate its definition, is the correct criterion for appraisal.

For more details on error propagation, confer: