 PDF version of this entire document
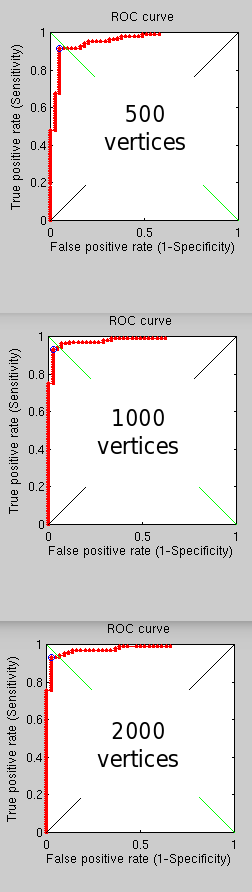
To provide insight into classification of all pairs (including ones where a decision can hardly be made), 3 ROC curves were produced.
In these experiments, one identical dataset was used so as to ensure the comparison is valid at this scale (apples to apples, not random). 300 images in total were used.
The experimental design was simple and the flow serial. This uses only one classifier - that which was originally designed to be a fallback for GMDS. It is in fact performing better than GMDS by now, as measured in terms of recognition rates.
Upping penalty terms and then moving down to 1000 vertices and 500 vertices (down from 2000), we are able to see the effect that the density of points on which distances are calculated has on overall performance. This ought to help learn whether or not adding more and more points will necessarily be beneficial or just time-consuming.
The conclusion is that even with as little as 500 vertices the results can be reasonably OK. First order distances are calculated on those. Adding more vertices improves things, but not by a considerable amount. This is quite consistent with the observation made following similar experiments with GMDS.
|
Roy Schestowitz 2012-01-08


