PDF version of this entire document


The entire image/data set has been stacked up inside loader functions for large experiments. Some special cases were then studied in order to work around them not by detecting but passing based on borderline scores. A bug in the penalties was found and corrected, even though these penalties depend on how the algorithm is varied (must be normalised wrt other variables).
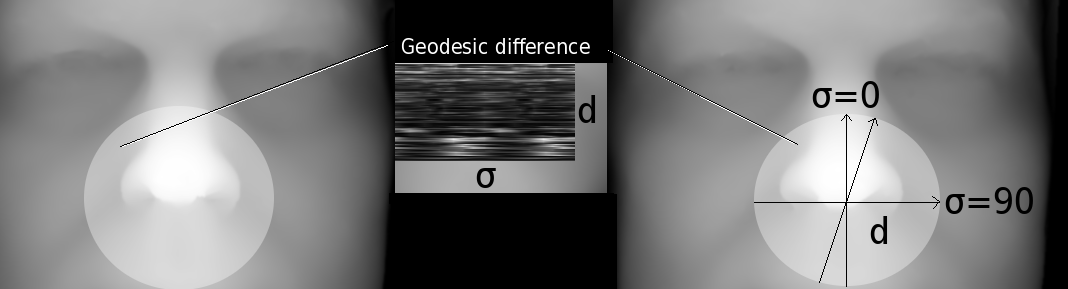
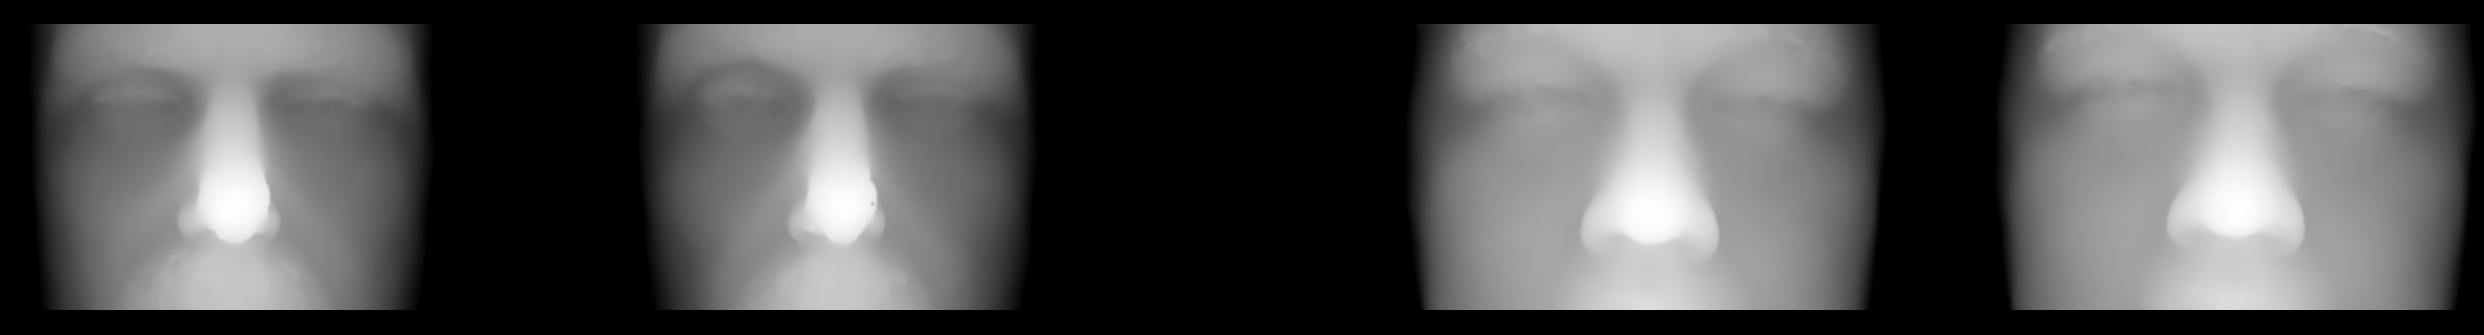
I am working on nice ways of visualising the localised geodesic errors between pairs, densely. This ought to help indicate, e.g. using colour maps/contours, where two individuals differ (if at all), at the very least helping a human assessment which uses Euclidean (human-visible) by providing 'geodesic lenses'.
For debugging or general analysis that helps understand why the same imaged person can be intrinsically different across images, a tool was made to highlight localised differences such that for each pair of any objects (not just faces), the discrepancy will be visually identifiable and therefore possible to factor out, baaed on observation. Algorithms can be adjusted accordingly to avert false negatives. To be more effective, it will need to be remapped more like a compass and overlaid with some colours.
|
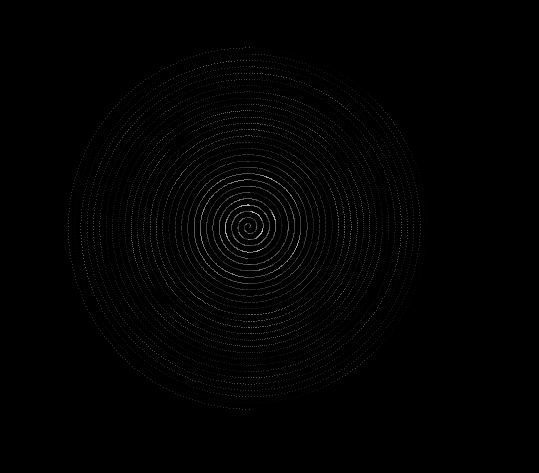
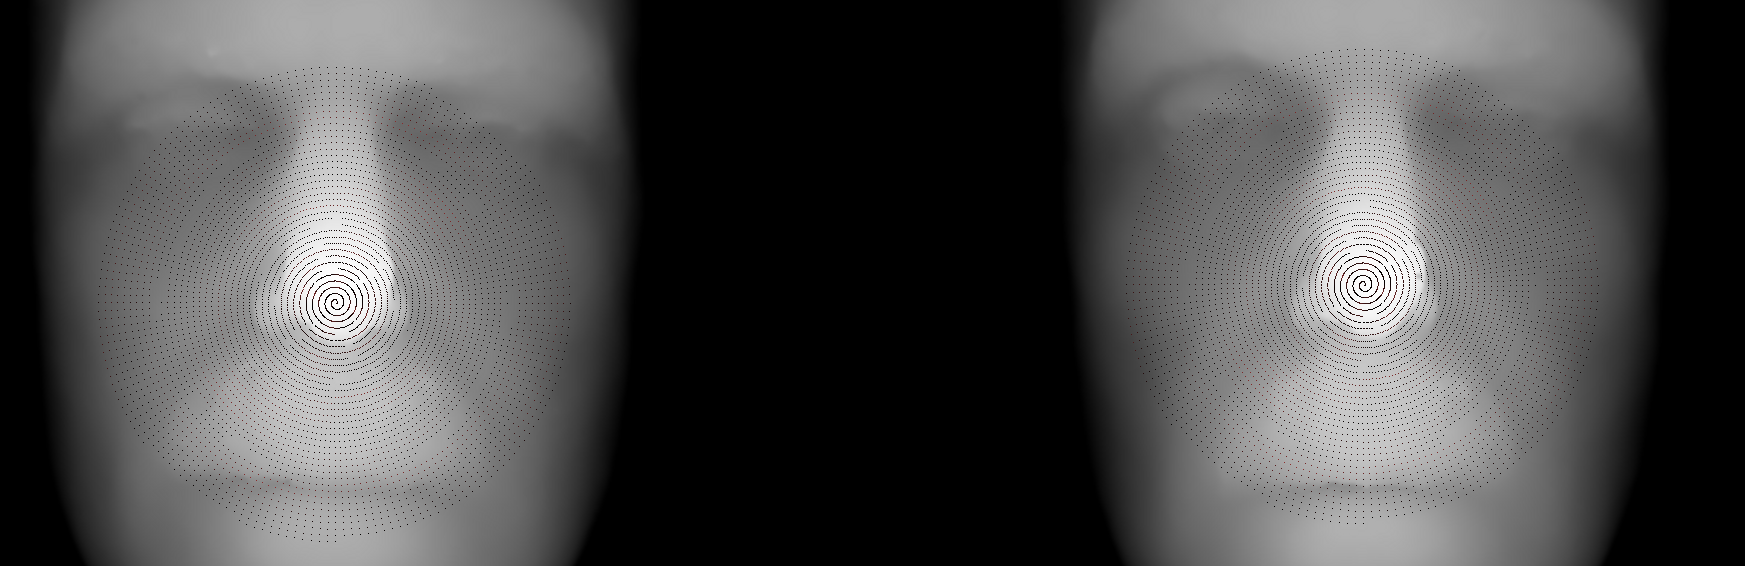
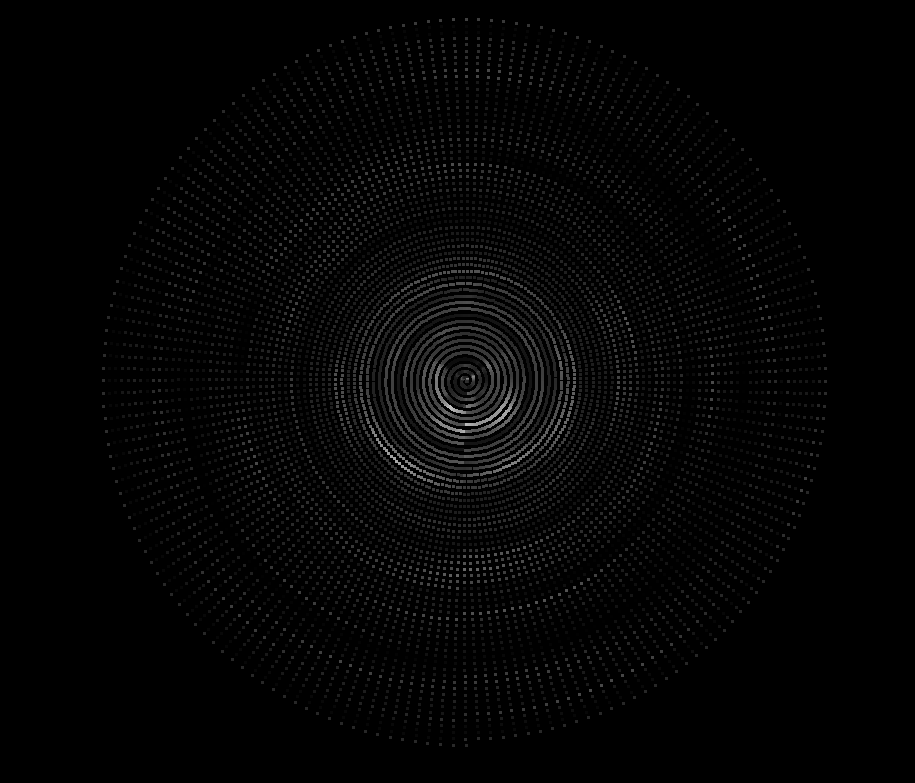
The overlay of choice is a spiral where lines represent D sampled varying (increasing) distances away from the fiducial/key point, wherein degrees are represented in a way that can relate to the original images. Overlaying the images in a way which cannot obscure anything may require colour, though.
Overlays of geodesic distance indicators are not easy to make visible, even by 'redifying' an intensity-scaled indicator of distance. At the moment, the output looks something like in:
We will improve this further in a moment.
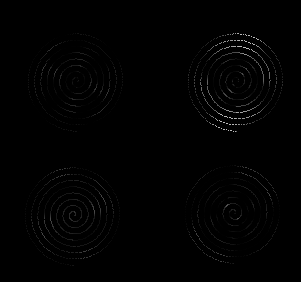
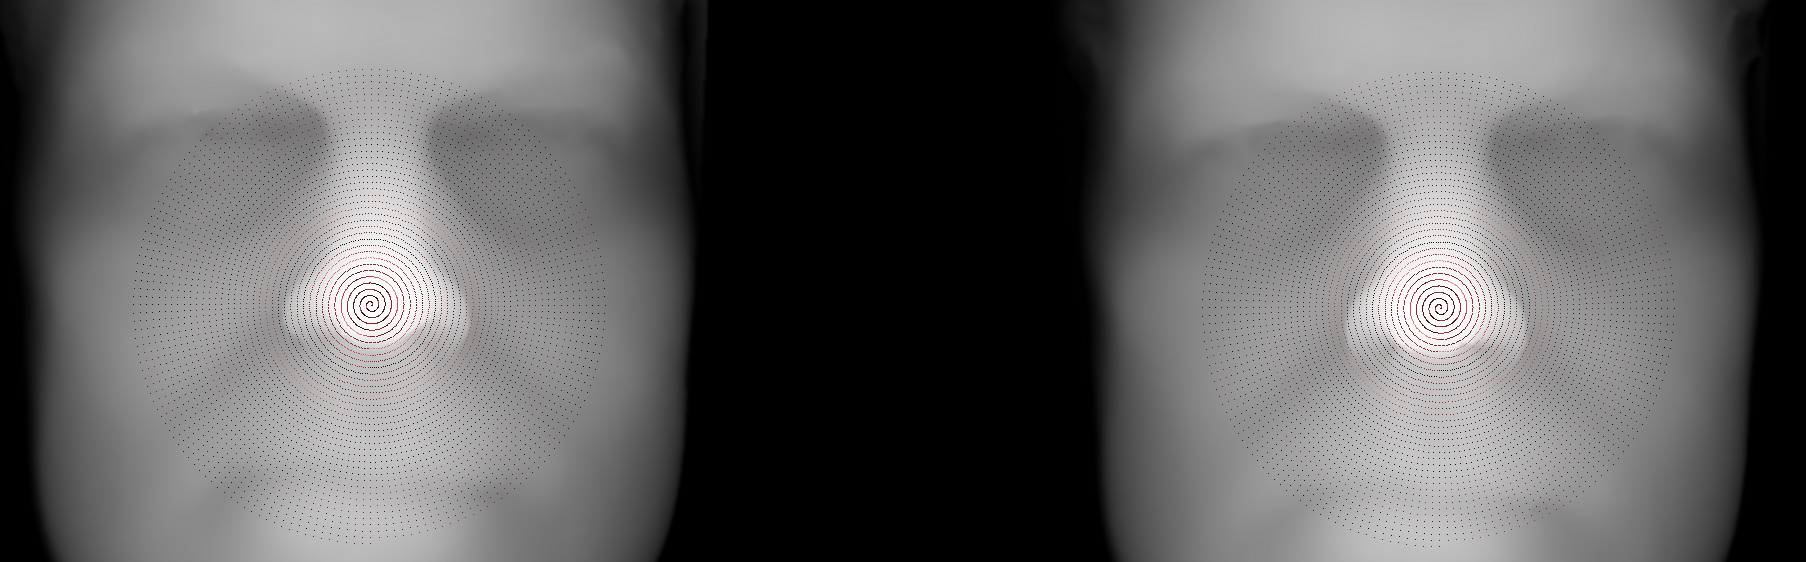
At the point where detection rates are improving it is usually the
subtle localised errors (with very high values) that put the whole
classifier at peril. Using these maps ought to help judge - on a
case-by-case basis - the composition of the overall score. I am currently
examining the image pairs with those charts apart in order to better
understand what to tweak for improved performance, especially fewer
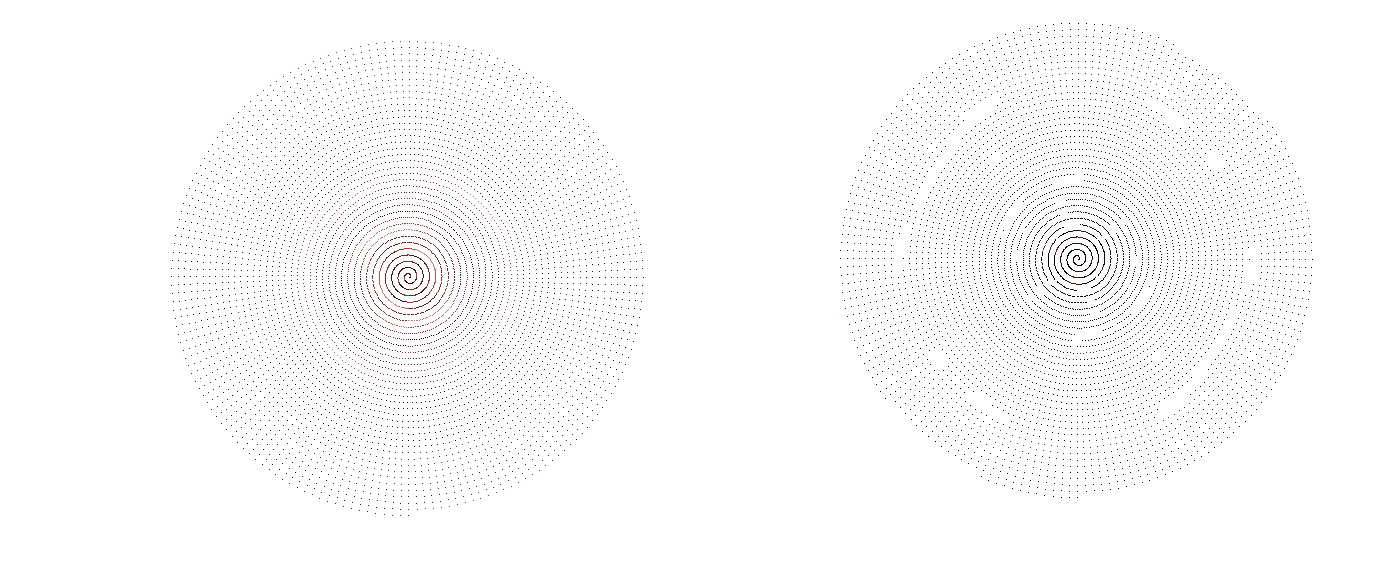
false negatives. The points have been dilated someone to improve visibility,
as shown in Figure ![[*]](/IMG/latex/crossref.png) .
.