PDF version of this entire document
We can, in principle, work on the ROC curves right now, however they would not be impressive and this also requires a lot of work that can be avoided if we get sent additional data from groups that plotted these curves (ROC I-III).
The good news is that after some failures I did manage to build an EDM (expression model) from the whole training set of FRGC. That's a set comprising 943 3-D datasets in total. The bad news is that I have not heard back from Faisal, so I ended up contacting his Ph.D. supervisor. We need their data to reproduce their results. They do not use only the FRGC training partition.
In the mean time I am adding more similarity measures and then using these, testing them with some galleries (we still need more metadata such as expression or subject ID, e.g. in order to split properly into subsets).
Today I delved into visual inspection of the model as visualisation leaves bare the coarser elements of it, which result not so much from misregistration as much as from the difficulties inherent in data filtering, bringing justification to further tinkering with parameters such as thresholds and binary mask types (there are 4 type of these right now).
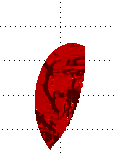
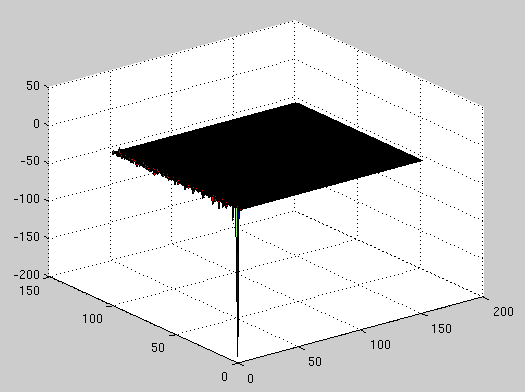
At first we encountered some improper cropping as shown in Figure
![[*]](/IMG/latex/crossref.png) and later I resolved that with
better code (on the GIP dataset it already does this reliably enough,
but there is low diversity there, being intra-personal and acquired
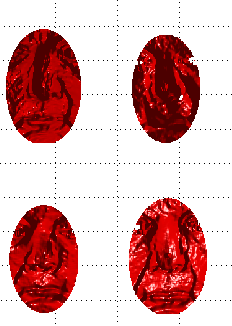
in one location with one modality). What we are getting right now
into the model can be seen in Figure
and Figure . The model takes several
hours to build, which is not too bad given that it is not a compiled
program and not a dedicated server, either.
and later I resolved that with
better code (on the GIP dataset it already does this reliably enough,
but there is low diversity there, being intra-personal and acquired
in one location with one modality). What we are getting right now
into the model can be seen in Figure
and Figure . The model takes several
hours to build, which is not too bad given that it is not a compiled
program and not a dedicated server, either.
got access to the ICP code. This server has always been hard for me
to access as it's not UNIX/Linux-based. While waiting for neutrals,
gallery, and ROC I-III metadata we have been looking at the models
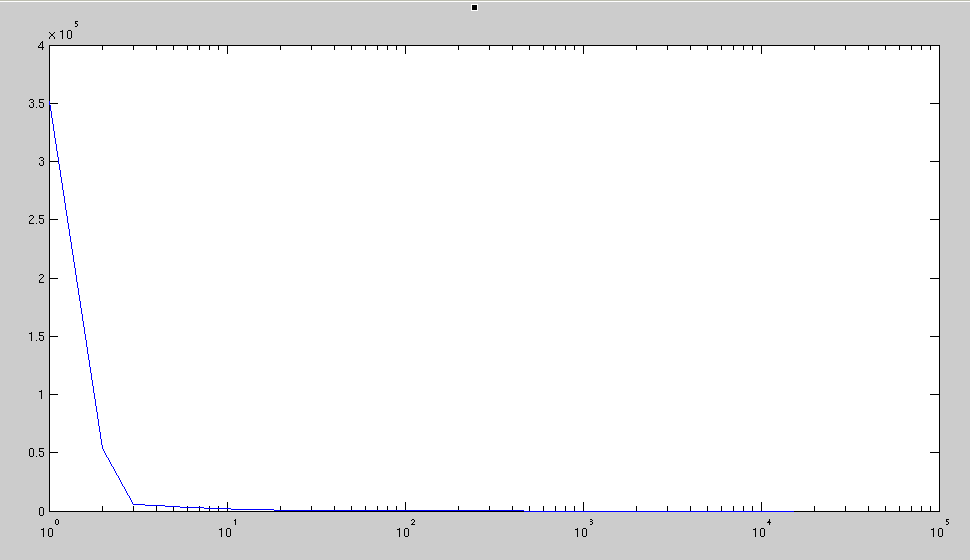
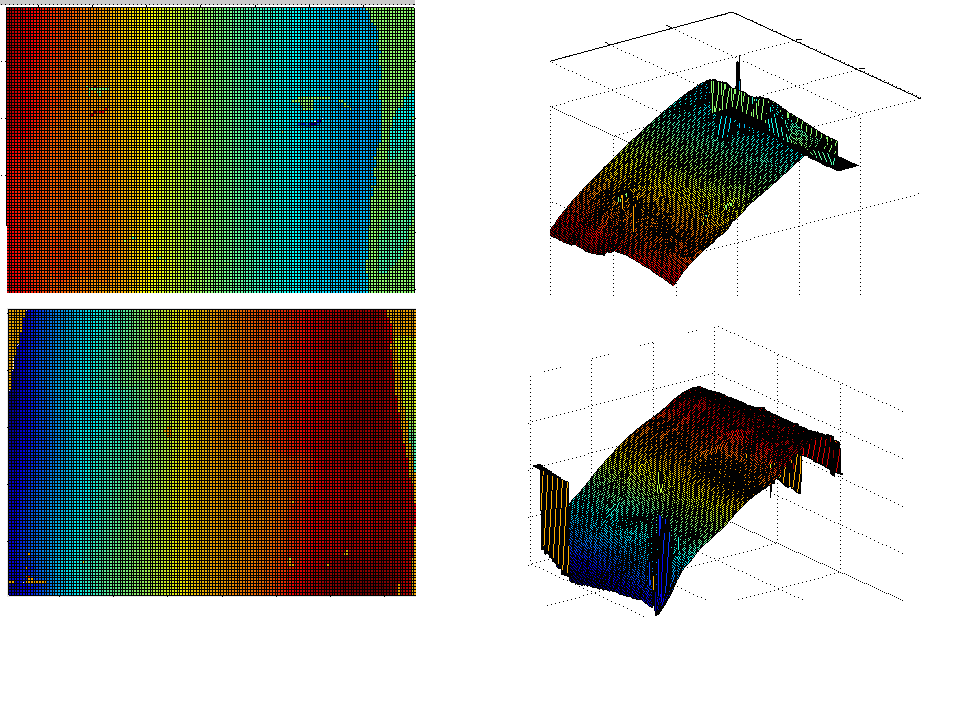
I built from FRGC data. With access to UWA's missing data, better
EDMs can be built, but in the mean time we looked at PCA space and
visualised it a bit (see Figure ), also
ironing out some bits of code and bugs along the way (mostly UI-related).
``Unfortunately,'' explained to us the group of the original EDM paper, ``the volunteers (from whom the data was collected) did not give us permission to distribute their 3D face data.'' We understand this fully and will try to acquire similar datasets at our lab. Sadly, we cannot have the data they used to perform benchmarks, but it seems safe to suppose that similar experiments can be designed with different data. The EDMs would be different.

|
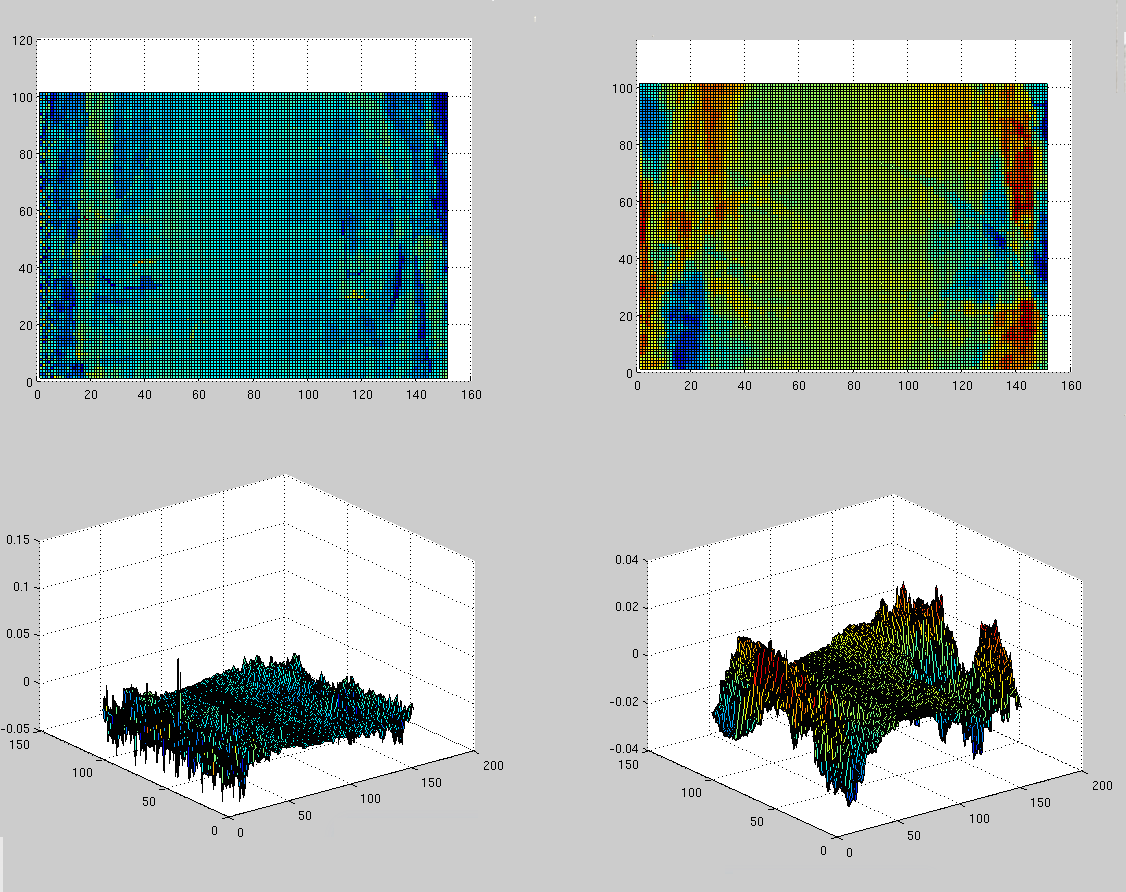
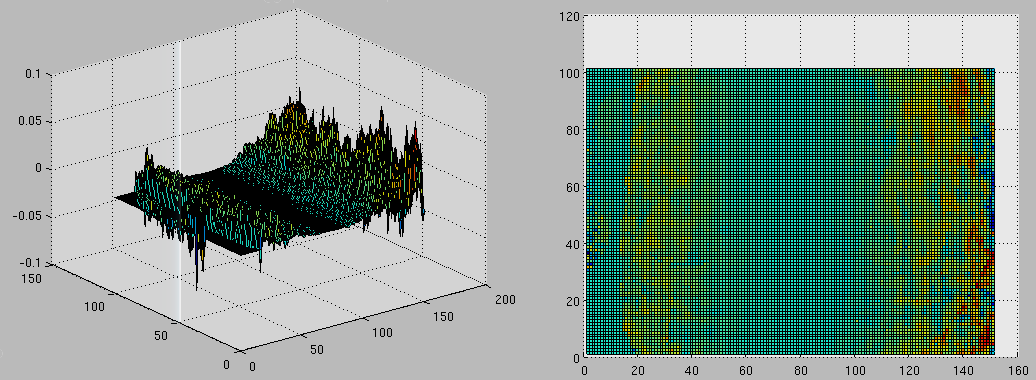
More EDM work was used to explore the newly-built models. Looking
at the models that lack the necessary training data from UWA, Figure
shows the distribution of modes'
weight based on the model built from the FRGC datasets.
Figure reveals interesting
circular patterns that show point-to-point correlation along the 10th
utmost principal axis (similar to the previously shown images in Figure
).
Figure is similar to the previous ones,
but it is a representation of scores rather than principal modes of
variation.
We have asked all 3 authors of the IJCV paper if we can get access to their data in order to replicate their methods and ensure these are reproducible on the same data. I was polite and forthcoming, but I have received no response yet. Nevertheless, it is worth looking around the model for attributes which can be exploited in a novel way as a dissimilarity measure. This relates to some of the figures shown earlier. From what has been built so far (encompassing a very comprehensive set of images) it is non-trivial to identify one single area that serves as a fast-to-compute similarity measure. The implementation used in UWA is simplistic, probably for reasons of speed. But it would be valuable to reassure ourselves that it does work without any caveats. One method we now have implemented basically compares an EDM built with the gallery and one which is built with the gallery and the probe. It is assumed that - under the model space transformation hypothesis from EDM - the observation most similar to that of the probe in fact corresponds to the same person. This can be tested as a new method that has not been explored before. It might even be publishable.
It would be preferable to use exactly the same datasets to compare results, e.g. the rather unfair GMDS vs EDM benchmarks.
With no proprietary data available from the original authors, we decided to move forward. If we can define an experiment for our lab to execute in the lab, people would be happy to contribute our faces to science.
Given large enough datasets (as are already available in sufficient quantity under gipmain), there is a lot that can be learned from systematic variation of methods, parameters, and datasets. We can, for instance, define a protocol for experimenting with PCA in a more cunning way than the group from UWA, e.g. searching along the lines of particular modes of variation or determining similarity based on the determinant of the covariance matrix. The pieces are already in place (for the most part, including multiple pluggable paradigms like Viola-Jones') and I previously published several papers that adopt this line of work at Cootes' and Taylor's group. For ICP we can promote the photometric version which getting to grips with - either in binary or interpreted form - is something we work on.
The advent of PCA is not fully exploited in previous work, so there exists an opportunity to show work which truly builds upon prior work rather than imitate it poorly. Moreover, our methods for nose detection and ICP are more advanced. Their maturity in the literature makes them less ripe for adoption, though.
A rational experiment to perform would validate a PCA-based measure of choice and subsequently validate it using the GIP datasets. Then, the same can be done with GMDS. When validation is shown to be giving us a monotonic curve, e.g. dissimilarity as a function of the number of different people (this ought to work correctly one way or the other) in the set or level of perturbation applied to the dataset (noise, or better yet, diffeomorphic warps) we can run benchmarks on the data corresponding to Experiment 3 of FRGC 2.0. Overall, this would help demonstrate novelty in
Shown in the images below are some examples of EDM projections. Figure
shows the tenth mode of variation,
whereas Figure shows a projection.
|
|
Roy Schestowitz 2012-01-08