PDF version of this entire document
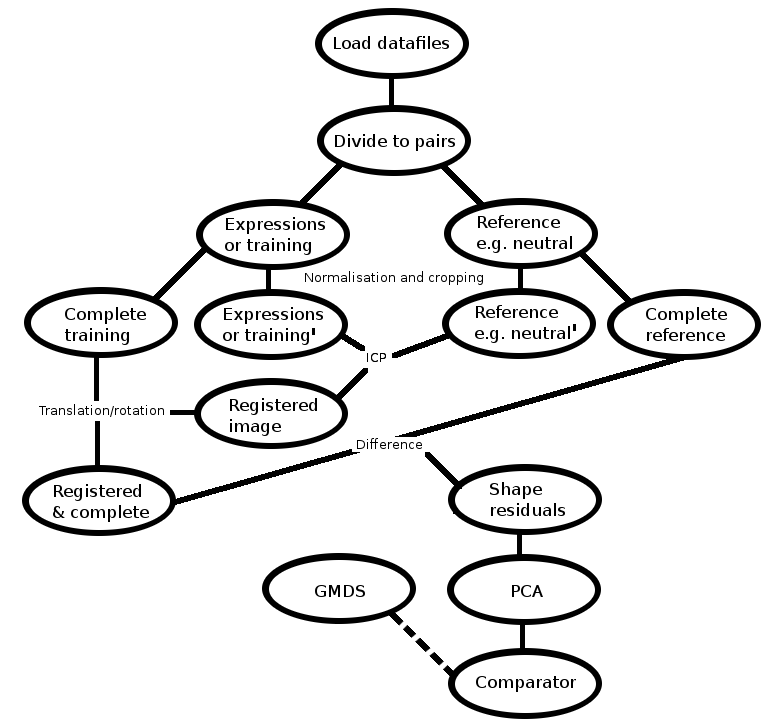
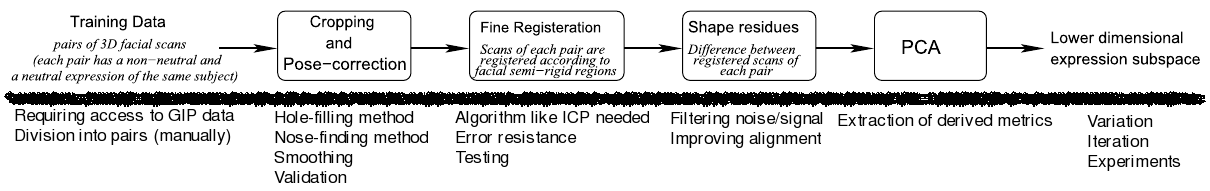
The framework constructed over the first couple of months can be seen
in Figure ![[*]](/IMG/latex/crossref.png) .
.
For the time being we concentrate on PCA and not GMDS. The key part is about PCA [], which MATLAB implements with http://www.mathworks.com/help/toolbox/stats/princomp.htmlprincomp; it is essential for constructing statistical models, via decomposition of face characteristics as derived automatically from the dataset.
|
Shown in Figure is an annotated version
of the original figure from the paper. The overview is simplistic
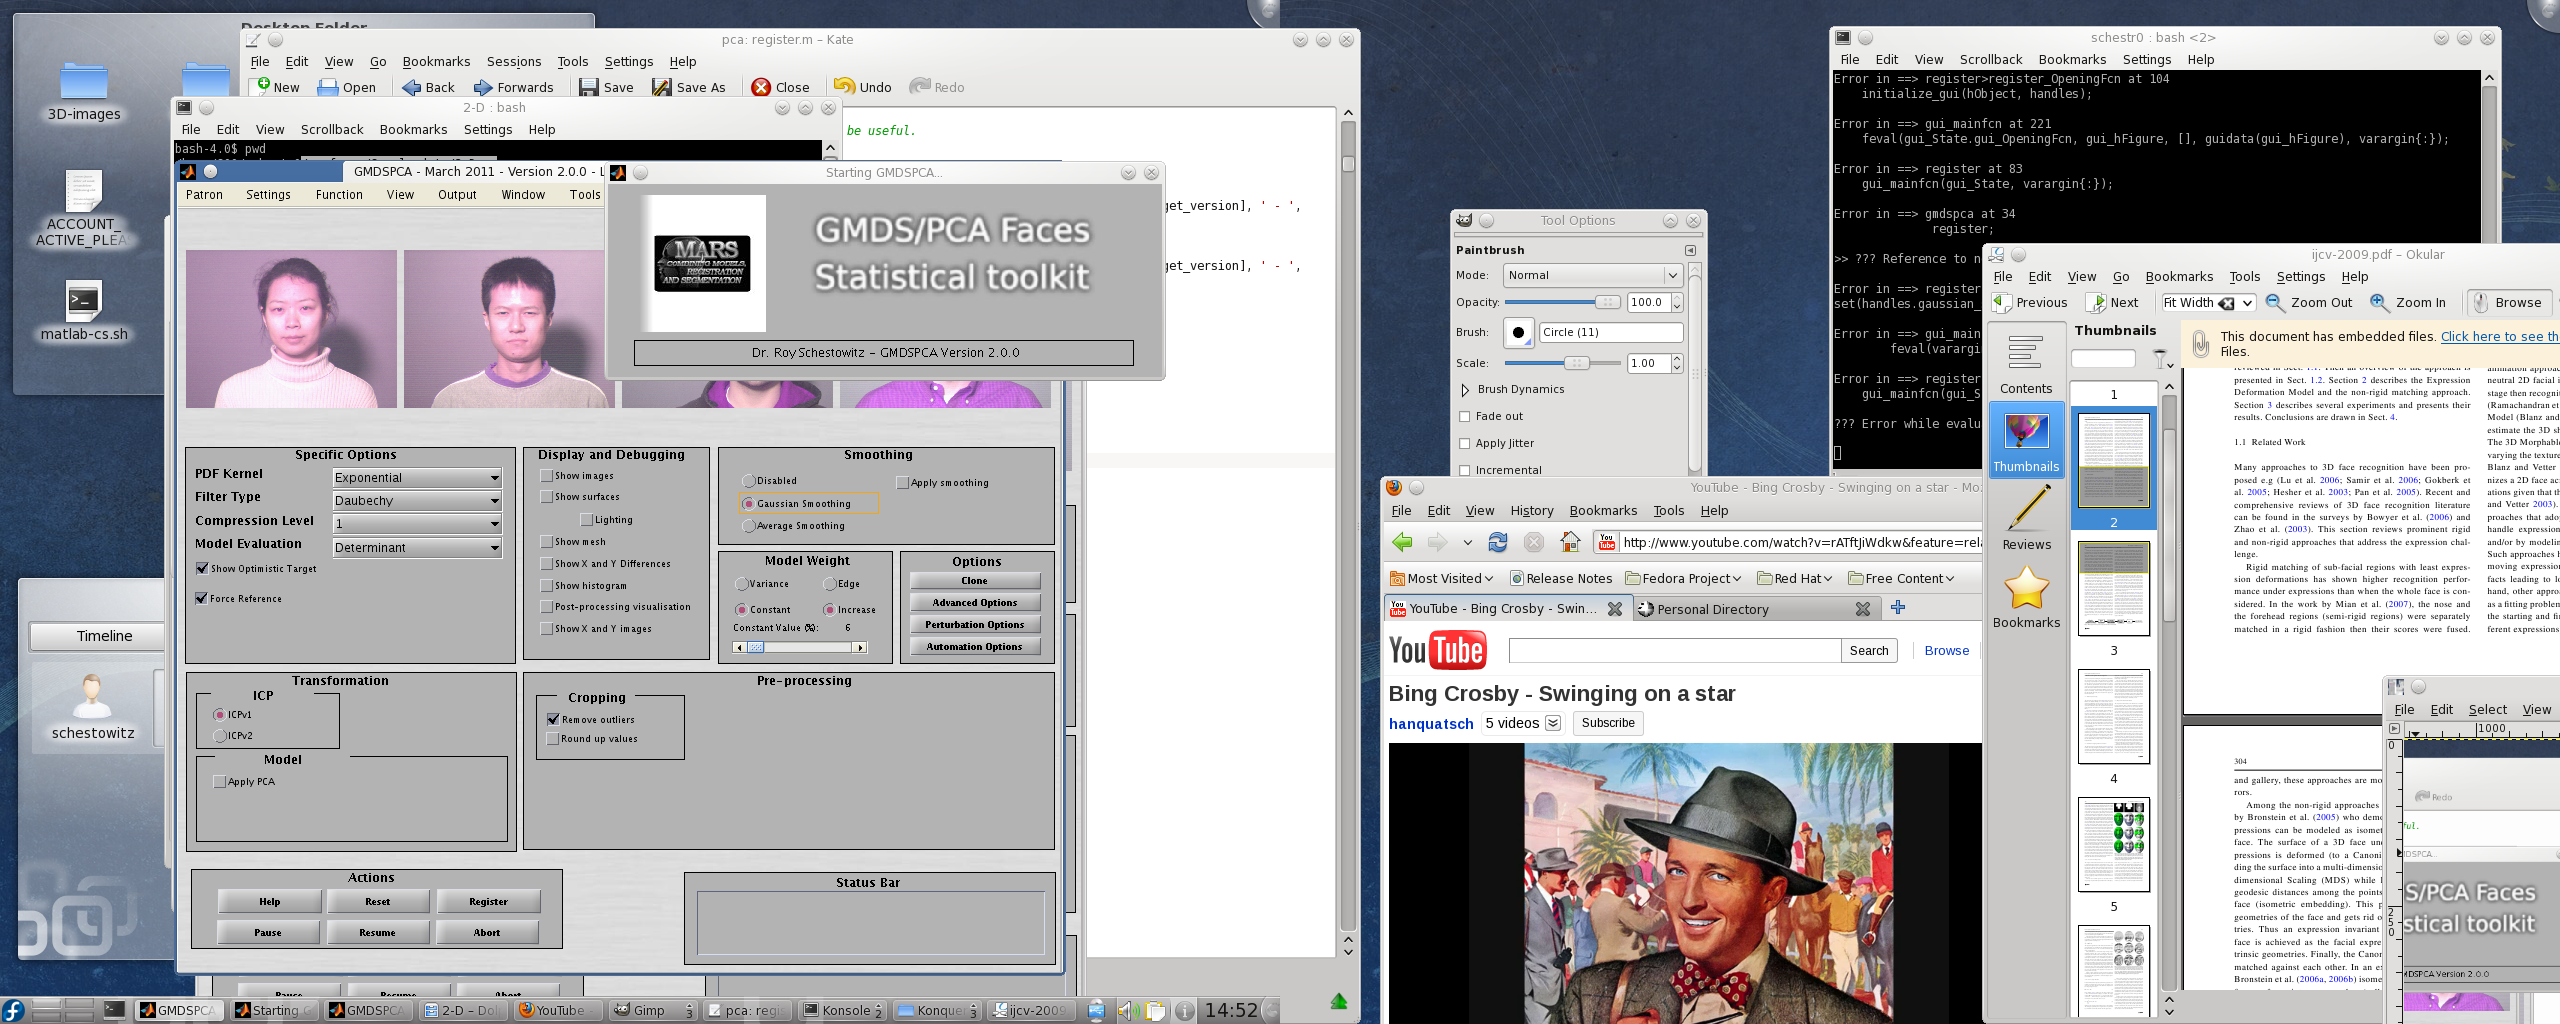
in the interests of abstraction and elegance. The graphical user interface
of the program we built looked like Figure
about a year ago (there have been many feature enhancements since).
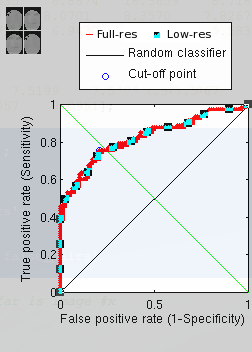
Using the PCA-based approach, we were initially able to get results
of reasonable standard. Figure shows the
ROC curve that accounts for hundreds of image pairs from the FRGC
dataset.
In a separate experiment, the images were downsampled by a factor
of 10 along each dimension, lowering by two orders of magnitude the
Z axis data that gets sampled by PCA based on a grid. This ought to
have kept the models more manageable for the purpose of algorithm/performance
testing. Interestingly enough, downsampling hardly affected the ability
to recognise faces. As Figure shows, the
classification remained almost the same, even though the images were
tiny (see Figure at the top left).
|
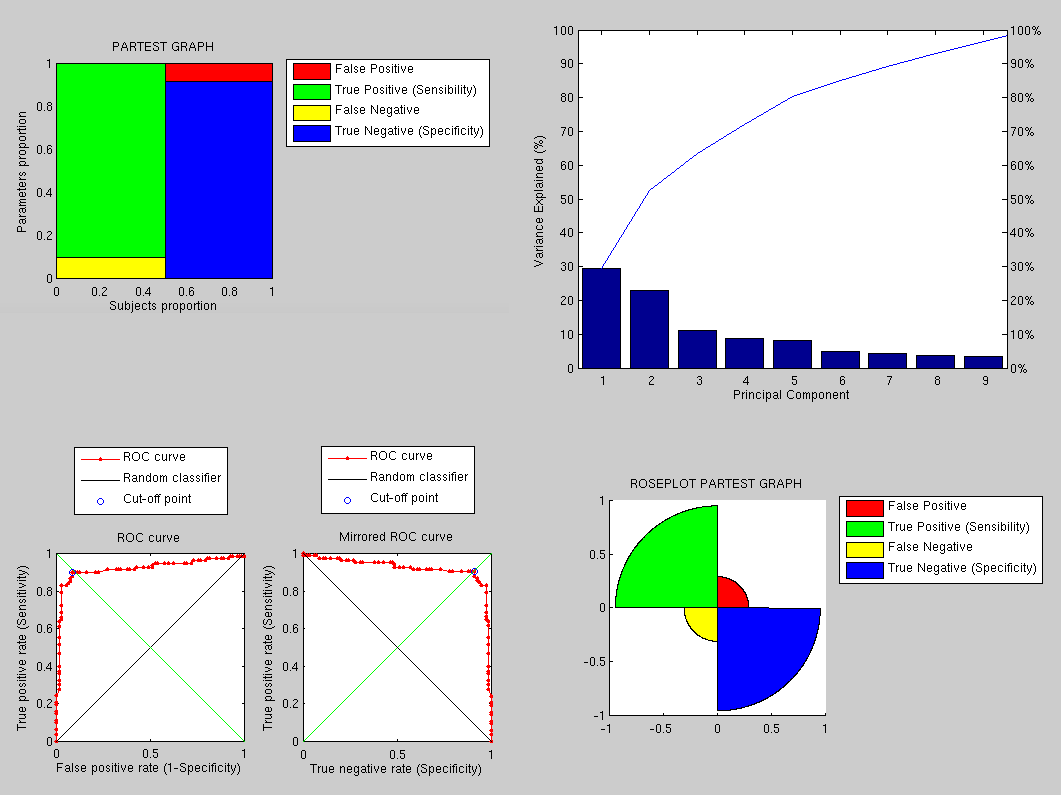
Using the same data and preprocessing as before (for the sake of a sound comparison), we have applied a PCA-based approach to get the following results, which are clearly by far superior. The variation incurred by expression is detected by PCA in the sense that it is not seen as a new type of variation.
|
The performance, as shown in Figure , is
therefore greatly improved and there is room for further improvements
as this implementation uses tiny images to save time and it does not
use the sophisticated approaches partly implemented by now.
|
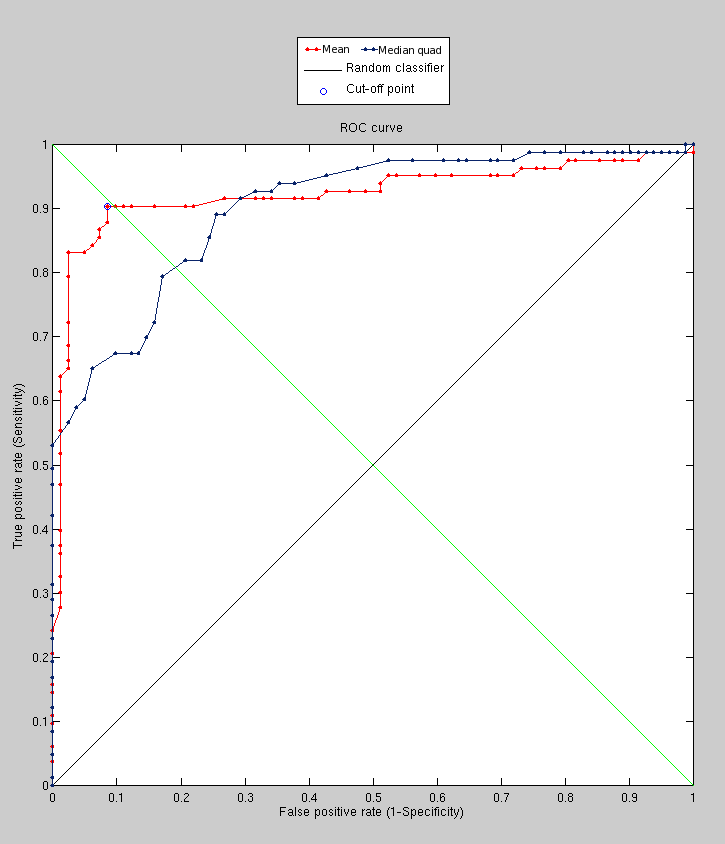
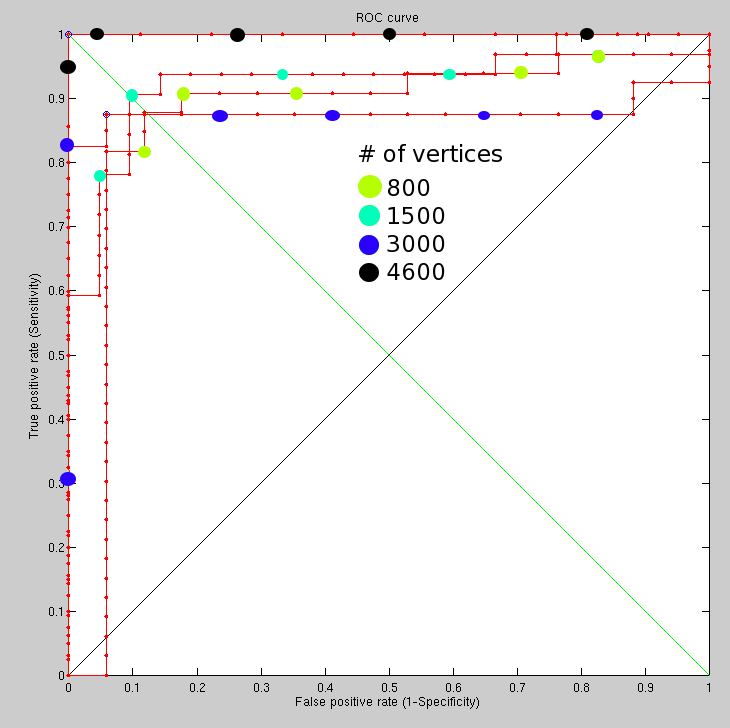
Using GMDS, the recognition performance reached at the early stages
was around 90%. There were limitations related to image resolution
and algorithms whose performance does not degrade linearly. These
experiments took a long time to set up and run (manually) because
of some freezing and stability issues at a resolution which translates
to 4,600 vertices. The combination with C++ code for stress minimisation
improved speed. The ROC curves in Figure
helps show the impact of the number of vertices on performance.
|
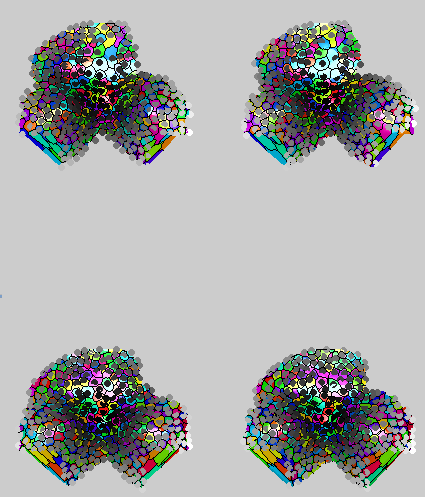
Areas of mismatch have been studied more closely in order to understand
what causes them. Several large images were looked at along with the
GUI (with previews of images enabled), showing quite clearly that
we must remove hair from the surfaces as many mis-detections are caused
by this. The aim is to get close to 99% recognition rate. The sample
size is not large enough for an sufficiently informative ROC curve,
but there are only a few wrong classifications. One is a borderline
case where pairs from different people almost seem like belonging
to the same person. The other case is mostly a case of GMDS not working,
not quite a wrong classification. At all resolutions attempted so
far, one pair of faces (same person imaged) cannot be made correspondent.
Other than that, there is almost an order of magnitude apart in terms
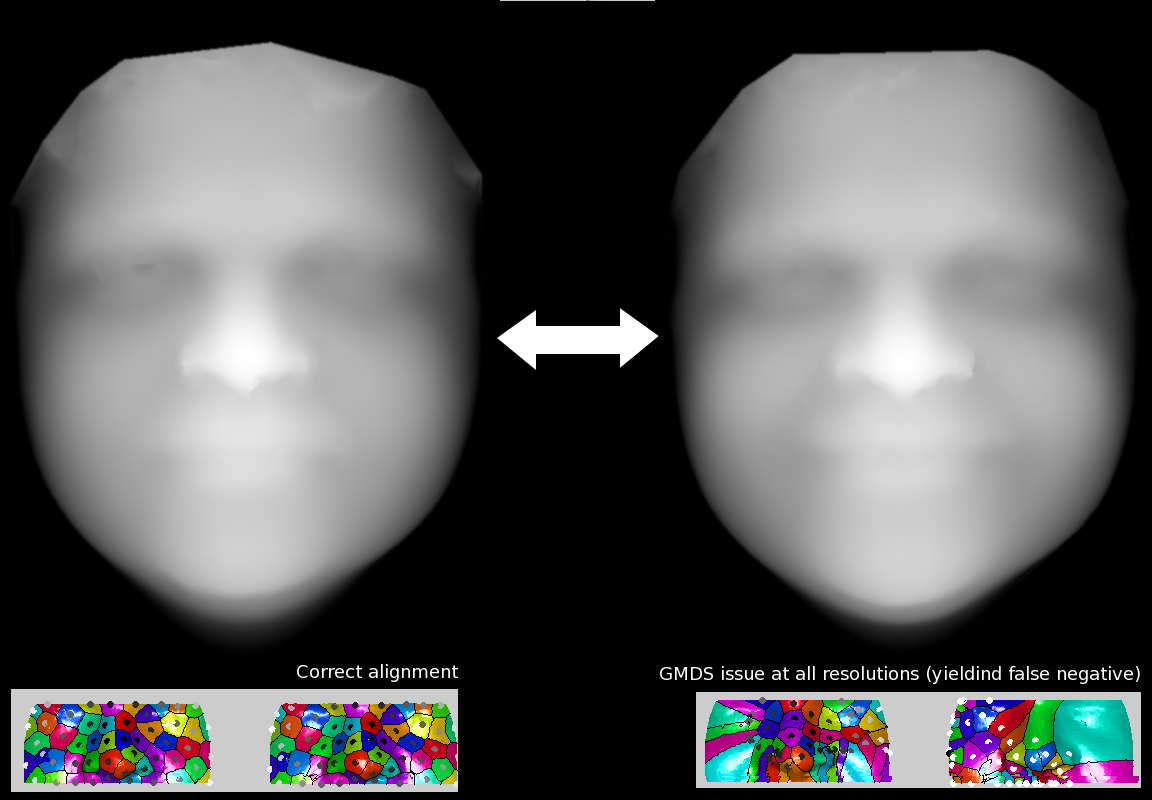
of separation between correct pairs and incorrect pairs. One important
issue to tackle is the rare case where GMDS hardly latches onto facial
features at all, as shown in Figure .
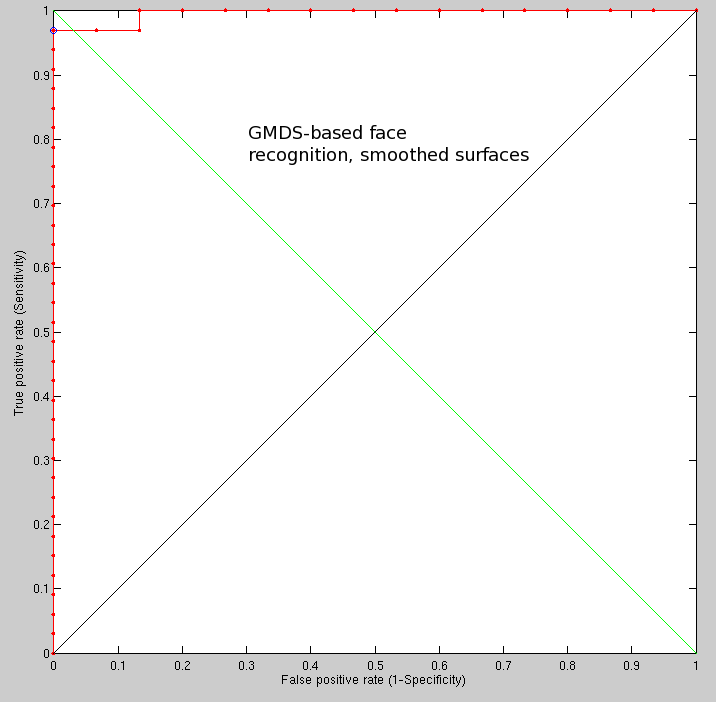
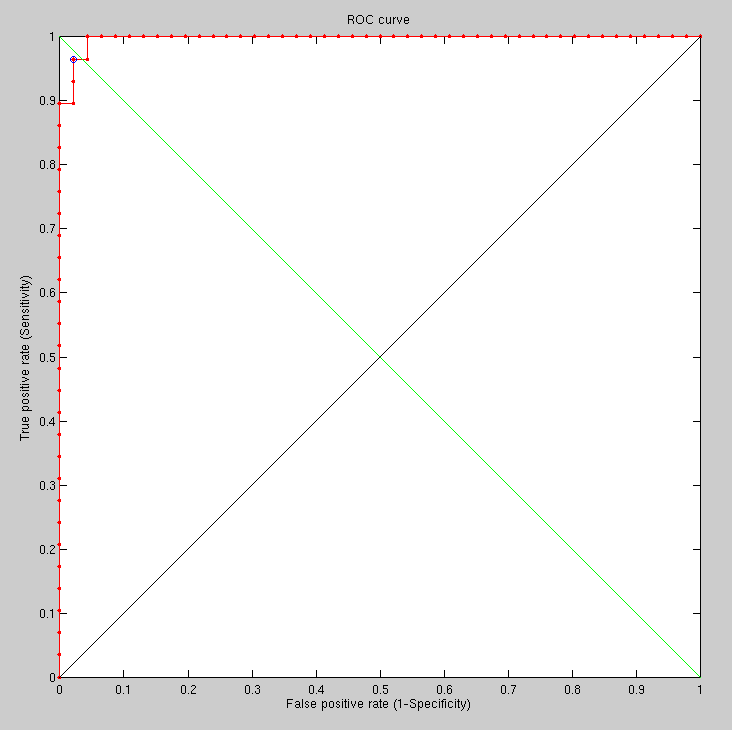
A GMDS-based identity verification task, with smoothed surfaces where
the resolution is increased for accuracy and for improved performance,
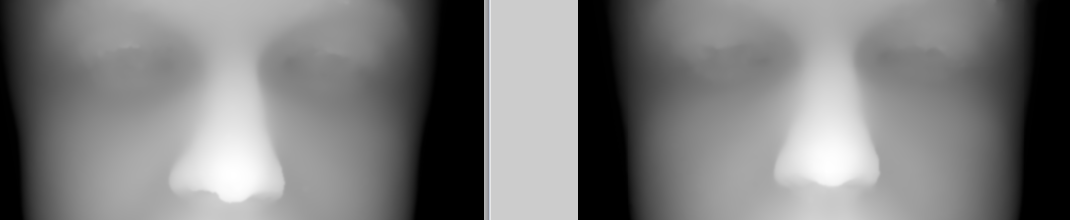
still works rather well (room remains for improvement). In the following
late experiment only one image was problematic, only slightly bordering
the threshold because of pose variation on the face of it (see Figure
). There was only one case where GMDS
failed. The ROC curve is shown in Figure
and it is the best performance level that we reached using this method.
That last curve was obtained by using a kernel/window 13 pixels across, moving average (horizontal and vertical). The 2-D Gaussian filter is another option.
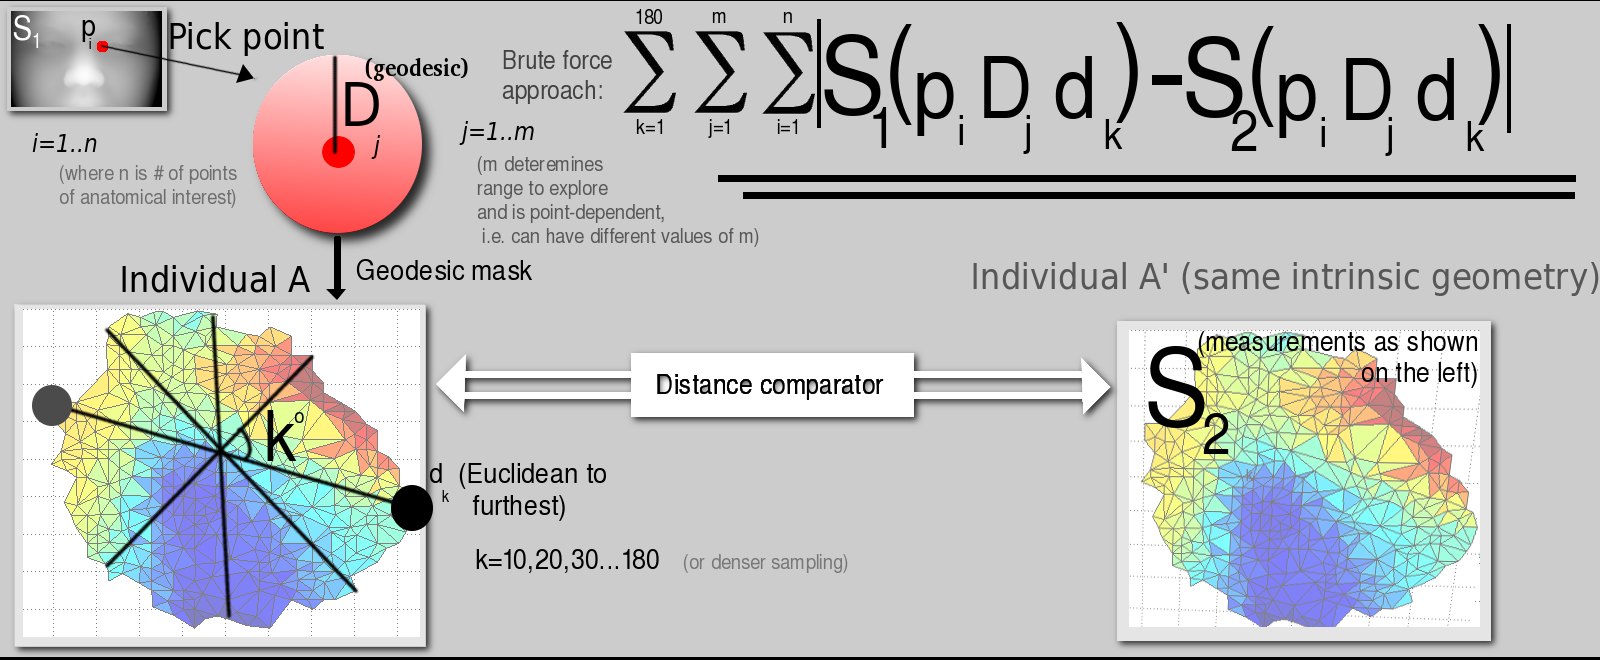
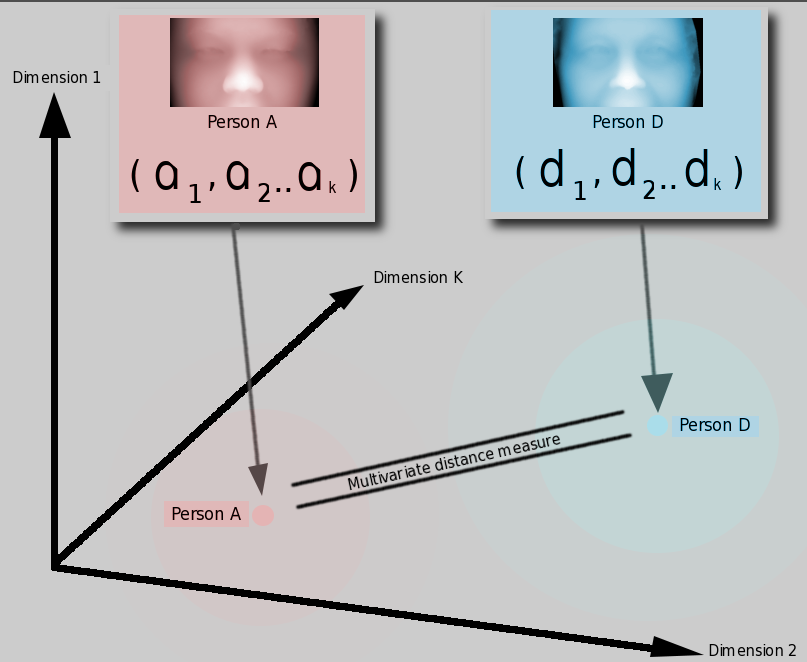
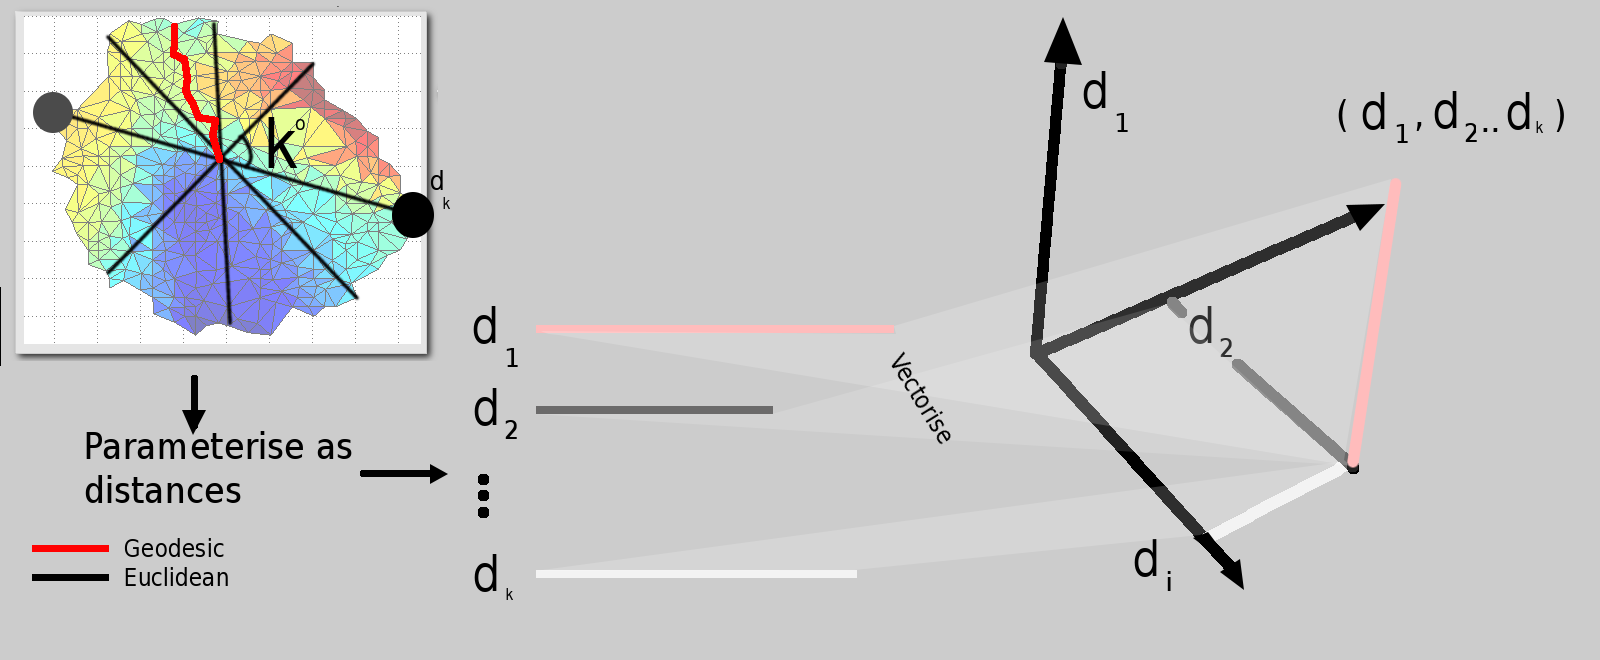
A newly-worked-on approach strives to measure distances between images in hyperspace based on their parameterised version, where these parameters are basically a small set of distances, each (hopefully) encompassing a sort of concise digital signature corresponding to a person's facial surface alone. The sketch below shows the approach. It is a brute force implementation that measures many geodesic distances and then compares surfaces based on distance-to-distance subtractions. It is not particularly clever, but the results of recognition tests are not too bad, either. They help validate the premise that by measuring Euclidean distances in XY, YZ, and XZ (based upon geodesic operators like FMM) we are able to carve out the surfaces and extract meaningful measures from the sub-surfaces.
Another figure, Figure , shows the
next step.
|
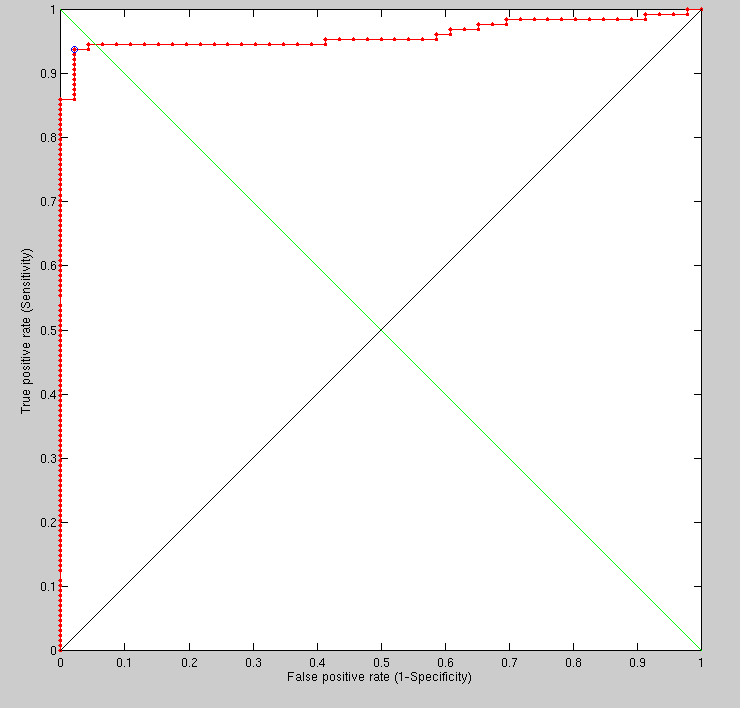
Taking the first imaged individual vs different imaged individuals
(92 different individuals), the following results are obtained using
the new method, which was refined and adjusted to the task at hand
(Figure ), unlike GMDS which is generic
and adaptable.
|
We are able to see slight improvement incurred by the use of smoothing in the new FMM-based method. It makes sense to do this around the eyes, but currently the filter is applied uniformly to the entire image. At present, GMDS continues to show potential (more so than PCA), but its performance falls short of the modified algorithm detailed above.
|
Roy Schestowitz 2012-07-02