Progress Report
May 30th, 2006
Overview
- Revised TMI paper has been submitted
- MIUA paper accepted (also Carole's?), need to prepare camera-ready version
- BMVC - decisions within a fornight
- Validation experiments need to be re-run (seeding issue)
- Time appears suitable for thesis to be written uninterruptedly
- Some new papers of interest (TMI and TPAMI)
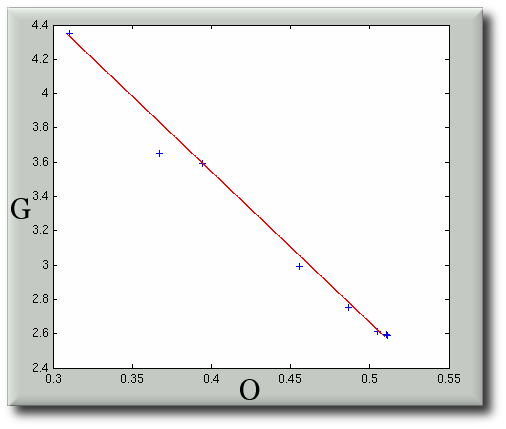
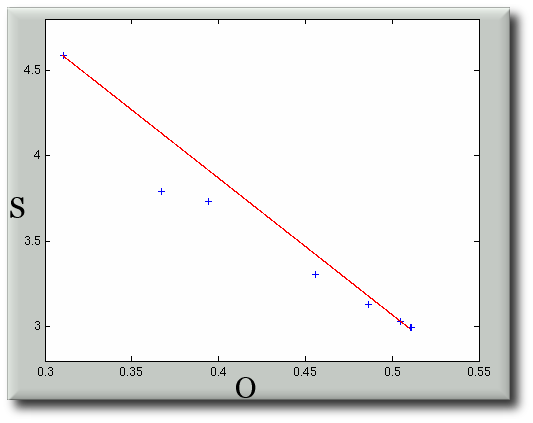
Overlap, Generalisation, and Specificity Data Scatters
- The red line is merely a straight line from the head to the tail
- Later on we fit a curve more properly and calculated the correlation coefficients
Generalisation versus Overlap
Specificity versus Overlap
Line Fitting and Correlation Ratio - Specificity
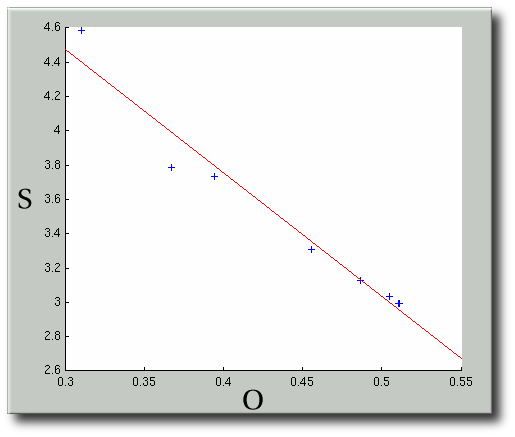
Plot with lines properly fit
Line Fitting and Correlation Ratio - Generalisation
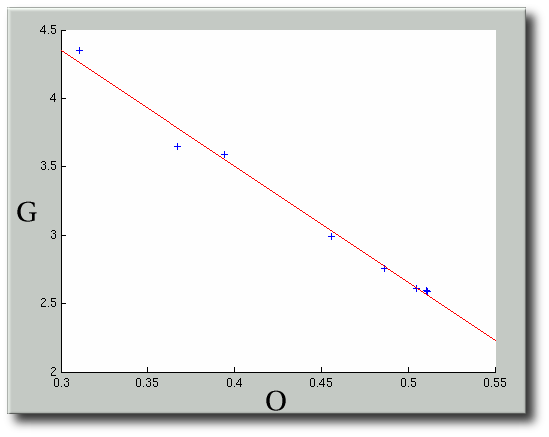
Plot with lines properly fit
Correlation Ratio
- Not too familiar with the correlation ratio, but here is what a MATLAB function could derive.
Specificity:


    1.0000   -0.9802

   -0.9802    1.0000


Generalisation ability:


    1.0000   -0.9950

   -0.9950    1.0000
Further Registration Experiments - Practical Application
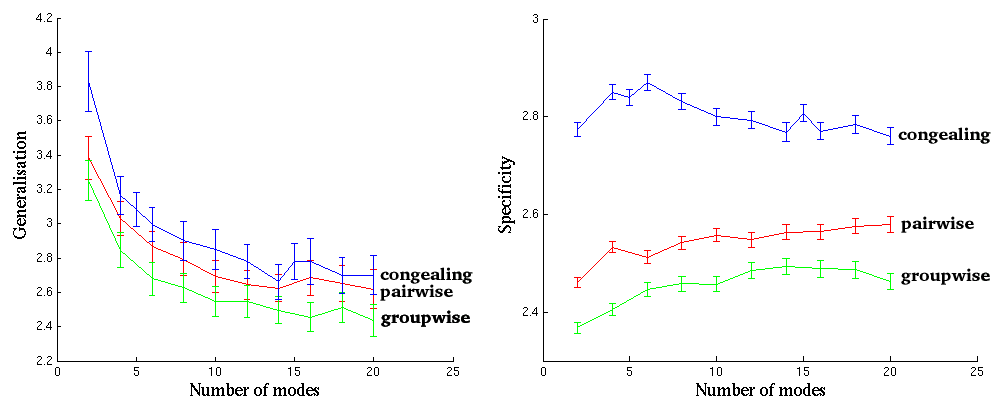
- The results to anticipate groupwise best, then pairwise, then congealing
- Probable explanation for poor congealing result
- PDF histograms may become multi-modal and thus the algorithm falls into a local minima
- It seems to be much slower to converge. All experiments used the same coarse-to-fine optimisation regime, and exactly the same number of iterations.
Various Points to Note
- Timescale for 3D NRR assessment: Tim's computer can complete 104,000 image comparisons within 15 minutes or so. Here are some thoughts and figures:
- shuffle 5x5
- image size is roughly 140x140 pixels
- our 3-D data is comprises 51 slices
- shuffle distance neighbourhood turns from a square into a cube and it is the most CPU-intensive process
- In the validation experiment we used 15 modes, having decided that 10 and 20 modes give similar answers
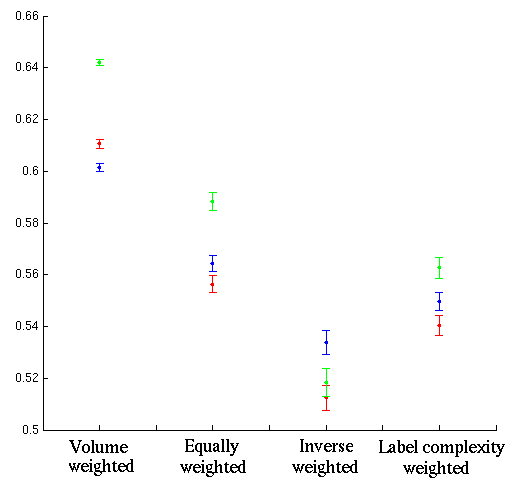
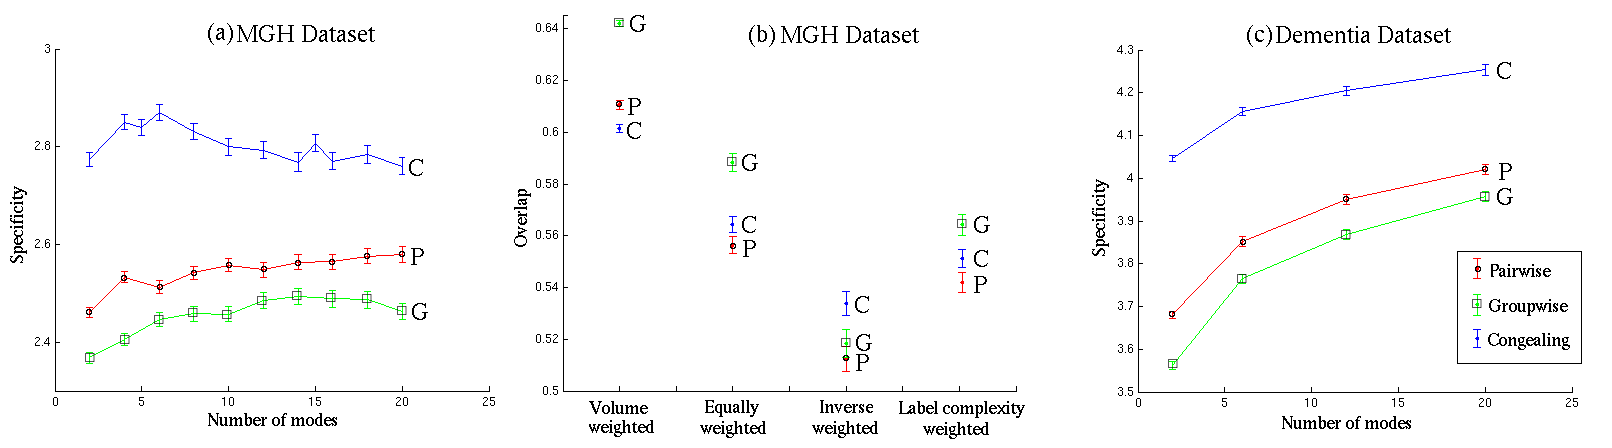
MGH Dataset: Overlap, Generalisation, and Specificity
- Overlap results plotted, as well as ours
- Curve/dot colours are consistent
- Included a combined plot, which shows all comparison between our 3 NRR algorithms
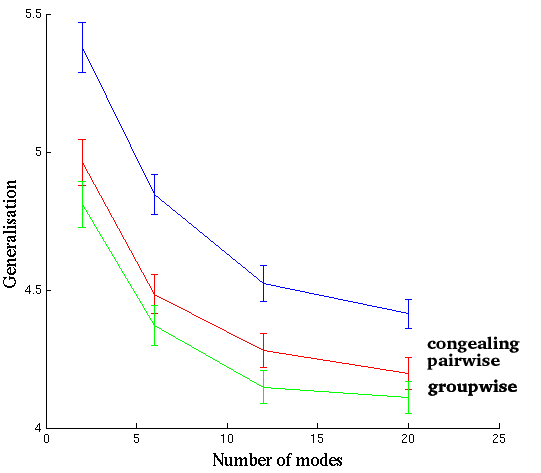
Dementia Dataset - Generalisation
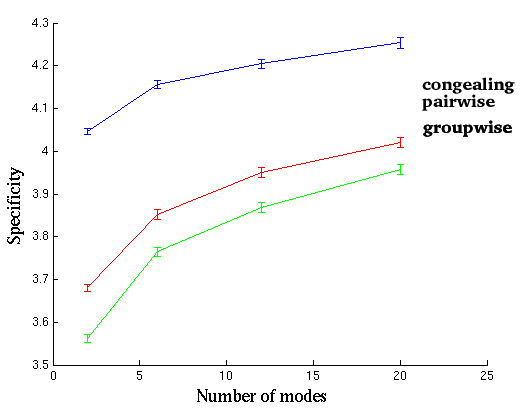
Dementia Dataset - Specificity
MGH Dataset - Overlap
Congealing, Pairwise, and Groupwise Registration
Registration Assessment Results - Generalisation
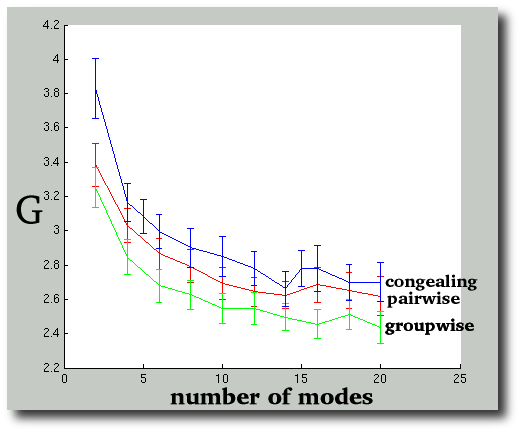
Registration Assessment Results - Specificity
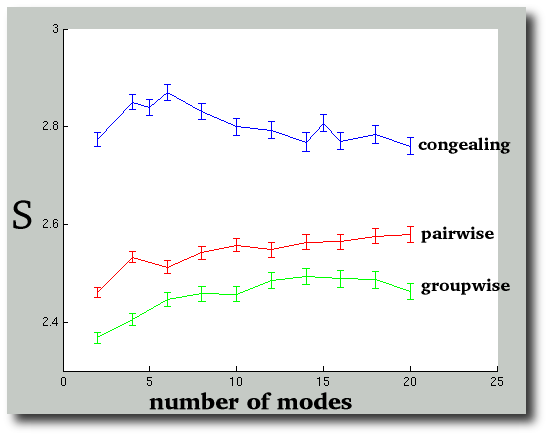
Large, Combined View of the Results
Papers of Interest
- Sent 3 papers by E-mail
- At least two of the three papers are relevant to our work
- They are not available in paper form yet, but the electronic versions were made available last week
MIUA 2006 Paper
- The paper "Non-Rigid Registration Assessment Without Ground Truth" has been accepted for presentation as an oral
- Medical Image Understanding and Analysis (MIUA2006) in Hulme Hall, July 2006
- Decisions about other papers -- particularly those with joint authorship -- have not been made public yet (at the time of writing)
- The paper will be published in the Conference Proceedings
- Need to turn the manuscript into camera-ready form as soon as possible
MIUA 2006 Paper - Ctd.
- Reviewers' comments needed to be considered carefully in revising the manuscript
- publication of the paper is conditional on a satisfactory response to the reviewers' comments
- This is particularly true for poster presenters
- Reviews of the paper follow, for discussion
Review 1
- Interest to MIUA Audience: Well suited to conference
- Scientific Quality: Mostly Good quality. Some questions over completeness or methodology.
- Comments to Authors: This is a well-written and easy-read paper. Simple statistics, overlap and distance based measures, are used to assess registration quality.
Review 1 - Ctd.
Some comments:
1. Should \beta_l also appear in equation (1)?
It does.
2. Is the shuffle distance the best way to measure difference between two images? Why not use the overlap again?
We can't. There is a misconception here.
3. It's quite often that there are illumination changes among images to be aligned. How these metrics cope with in this situation?
The model is normalising intensities; this works fine in practice; the image set may have been pre-processed to balance intensities.
Review 2
- Interest to MIUA Audience: Well suited to conference
- Scientific Quality: Good quality. Interesting work. Incomplete or flawed in detail
Review 2 - Ctd.
Comments to Authors:
A mostly clear paper.
However, the description in the text of the shuffle distance seems to contradict the caption of Figure 2 where the mean is not mentioned. The visual quality of Figures 4 and 7 is rather poor: I would suggest the use of a vector graphics format rather than bitmap. There is an extra comma after "that" in the last sentence of the conclusion.
Two more technical questions. Doesn't the shuffle distance (by the shuffling itself) mean that the non-rigid registration is not properly evaluated? In other words, local non-rigid deformations could be hidden by the shuffling, especially for large values of the radius. Is that a fair comment?
In Section 4, you have "the specificity obtained for the two groupwise methods is significantly better [...] implying better registration...". Was the registration indeed better? Can this be verified? After all, you are proposing a method to assess the registration so it would be nice to assess the performance of the assessment ;-)
TMI overlap experiments with MGH dataset
Review 3
- Interest to MIUA Audience: Well suited to conference
- Scientific Quality: Mostly Good quality. Some questions over completeness or methodology.
- Comments to Authors:
- The measure in (2) is not a measure of generalisation since it finds closest matches in the training set. Consider a model that can generate the training examples but nothing else. Such a model is optimal according to (2). I wonder whether the authors in fact used leave-one-out here? The measures of generalisation and specificity appear to be heuristics - is there any deeper theortical justification for them?
Review 3 - Ctd.
- It is stated that the Groupwise 1 method has "no constraints on the spatial deformations". I think it must have constraints albeit not from a statistical shape model.
- In order to interpret the functions in Figure 4 I need to understand what should be expected for a perfect/good/poor registration. I expect this is quite difficult to analyse since it will depend in a complex way on the data, the form of the random warps and the model. Presumably, in general, if the registration is extremely poor then random deformations will result in zero-mean changes to the measures. As the registrations become better, random deformations are more likely to result in decreased registration quality. But I wouldn't expect these functions to be linear. Why is averaging sensitivities over the range of perturbations shown in Figure 4 justified?
- I have some difficulty accepting the assertion at the end of the conclusions that the approach does not depend on the specifics of the registration method or the generative model. I think the authors should qualify this statement.