PDF version of this entire document


In order to show the type of outcome that I get from running a simple
NRR experiment, some typical results of running the basic NRR method
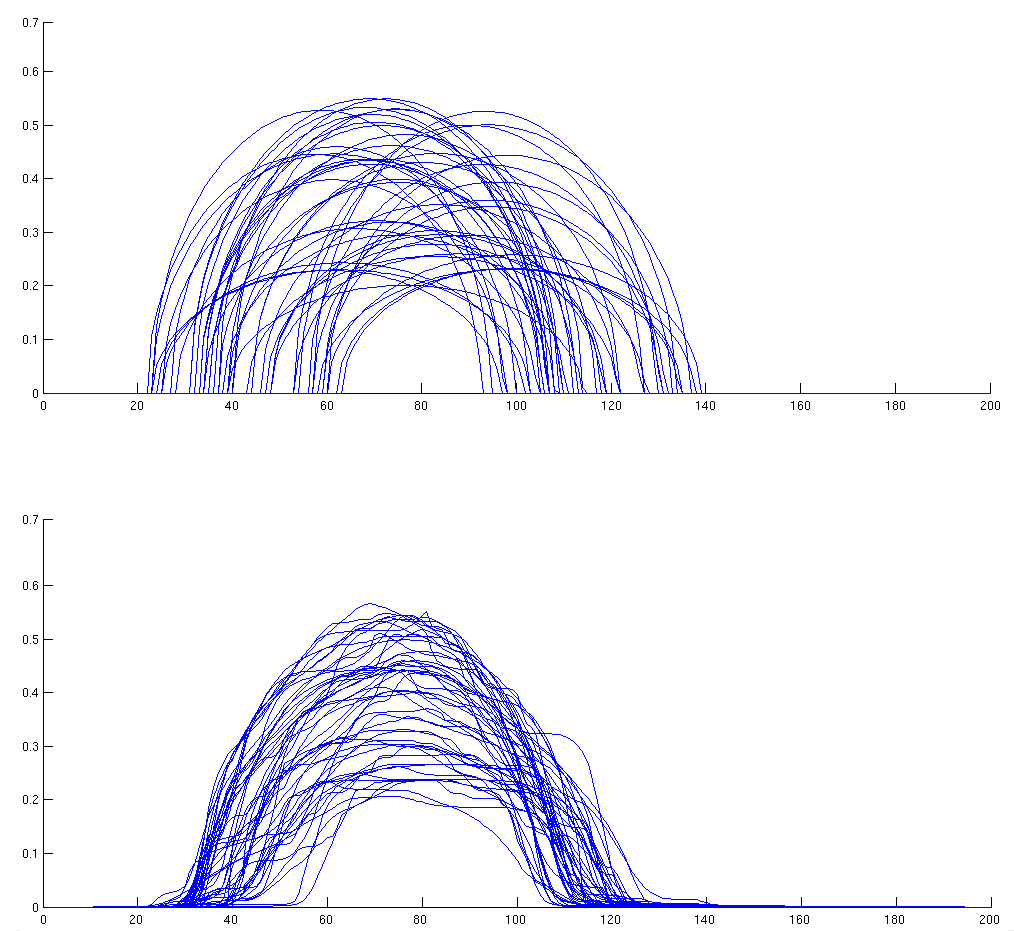
are presented below. Figure ![[*]](/IMG/latex/crossref.png) shows bump
images before and after they are aligned by NRR (200 iterations and
50 images, 200 pixels wide each).
shows bump
images before and after they are aligned by NRR (200 iterations and
50 images, 200 pixels wide each).
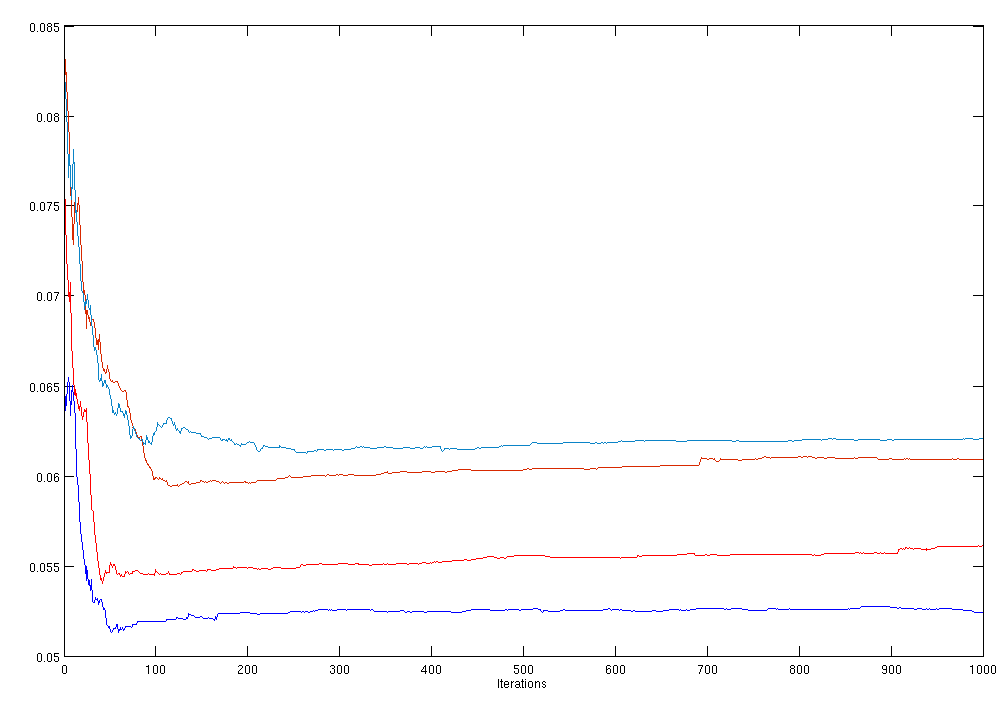
Figure shows the value of the objective
function over 1000 iterations. The mean distance from the correct
solution (which is known for the synthetic data) over 1000 iterations
is shown in Figure . The number of iterations,
which means full passes through all the data, is 1000, which seems
reasonable given that the curves reach a plateau before the experiment
is completed. This means that images are changed 50000 times overall
(1000 times for each image).

|
|
These results demonstrate that bump edges get aligned after just hundreds of iterations (minutes of running the algorithm) and convergence, as measured by the objective function, is reached at quite an early stage too. The images before and after registration show that alignment is far from perfect, but this is expected given the size of the image set and the type of warps that I apply. The results discussed here seem reasonable for the intended purpose, but they are not ideal.
The next few subsections look at how varying optimisation methods (or NRR parameters) affects the quality of NRR.