PDF version of this entire document
![[*]](/IMG/latex/crossref.png) and for visual examples.
and for visual examples.
A closer look at the SVN repository revealed nothing relevant that can intuitively give MDS-esque matrices, but that too will be added. The foundations must be laid down and debugged first.
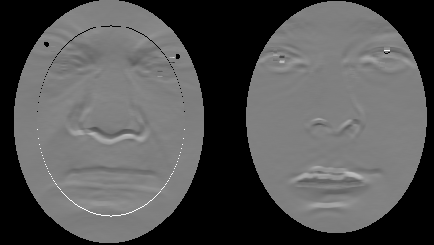
For each of the two surfaces, S and Q, the steepness of points along the Z axis can indicate the degree of curvature and irregularity, although distances are absolute and unless measured with a signed value, they will not convey information about directions. To measure this more properly we may need to travel on/near the surface and perhaps even interpolate to measure those distances more properly, namely in a way that preserves invariance properties. This effect will be studied shortly. The imminent goal is for PCA to be applied to the GMDS-esque geodesics matrix, which is a concise representation or coding of a face, mostly invariant to pixel-wise difference and motion of parts in connected tissue.
As a first stage, we take the X and Y derivatives (gradient) and consider these as implicit shape descriptors. To be more precise, we use derivative images with smoothing of radius 6 to have a sense of direction to be used as an identifier, not necessarily expecting it to be a valuable discriminant. This image is being smoothed because of the sparse sampling on a grid (8x8 points apart, which make up about 150 dimensions).
One could argue that the equally sampled set of curvatures provides insight into the spatial information in a way that is hardly affected by length of nose relative to the face, for example. Using a fusion of both might also be worthwhile, e.g. a combined PCA model of depth and curvature and/or geodesic/Euclidean distances.
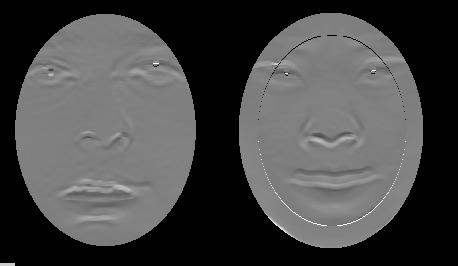
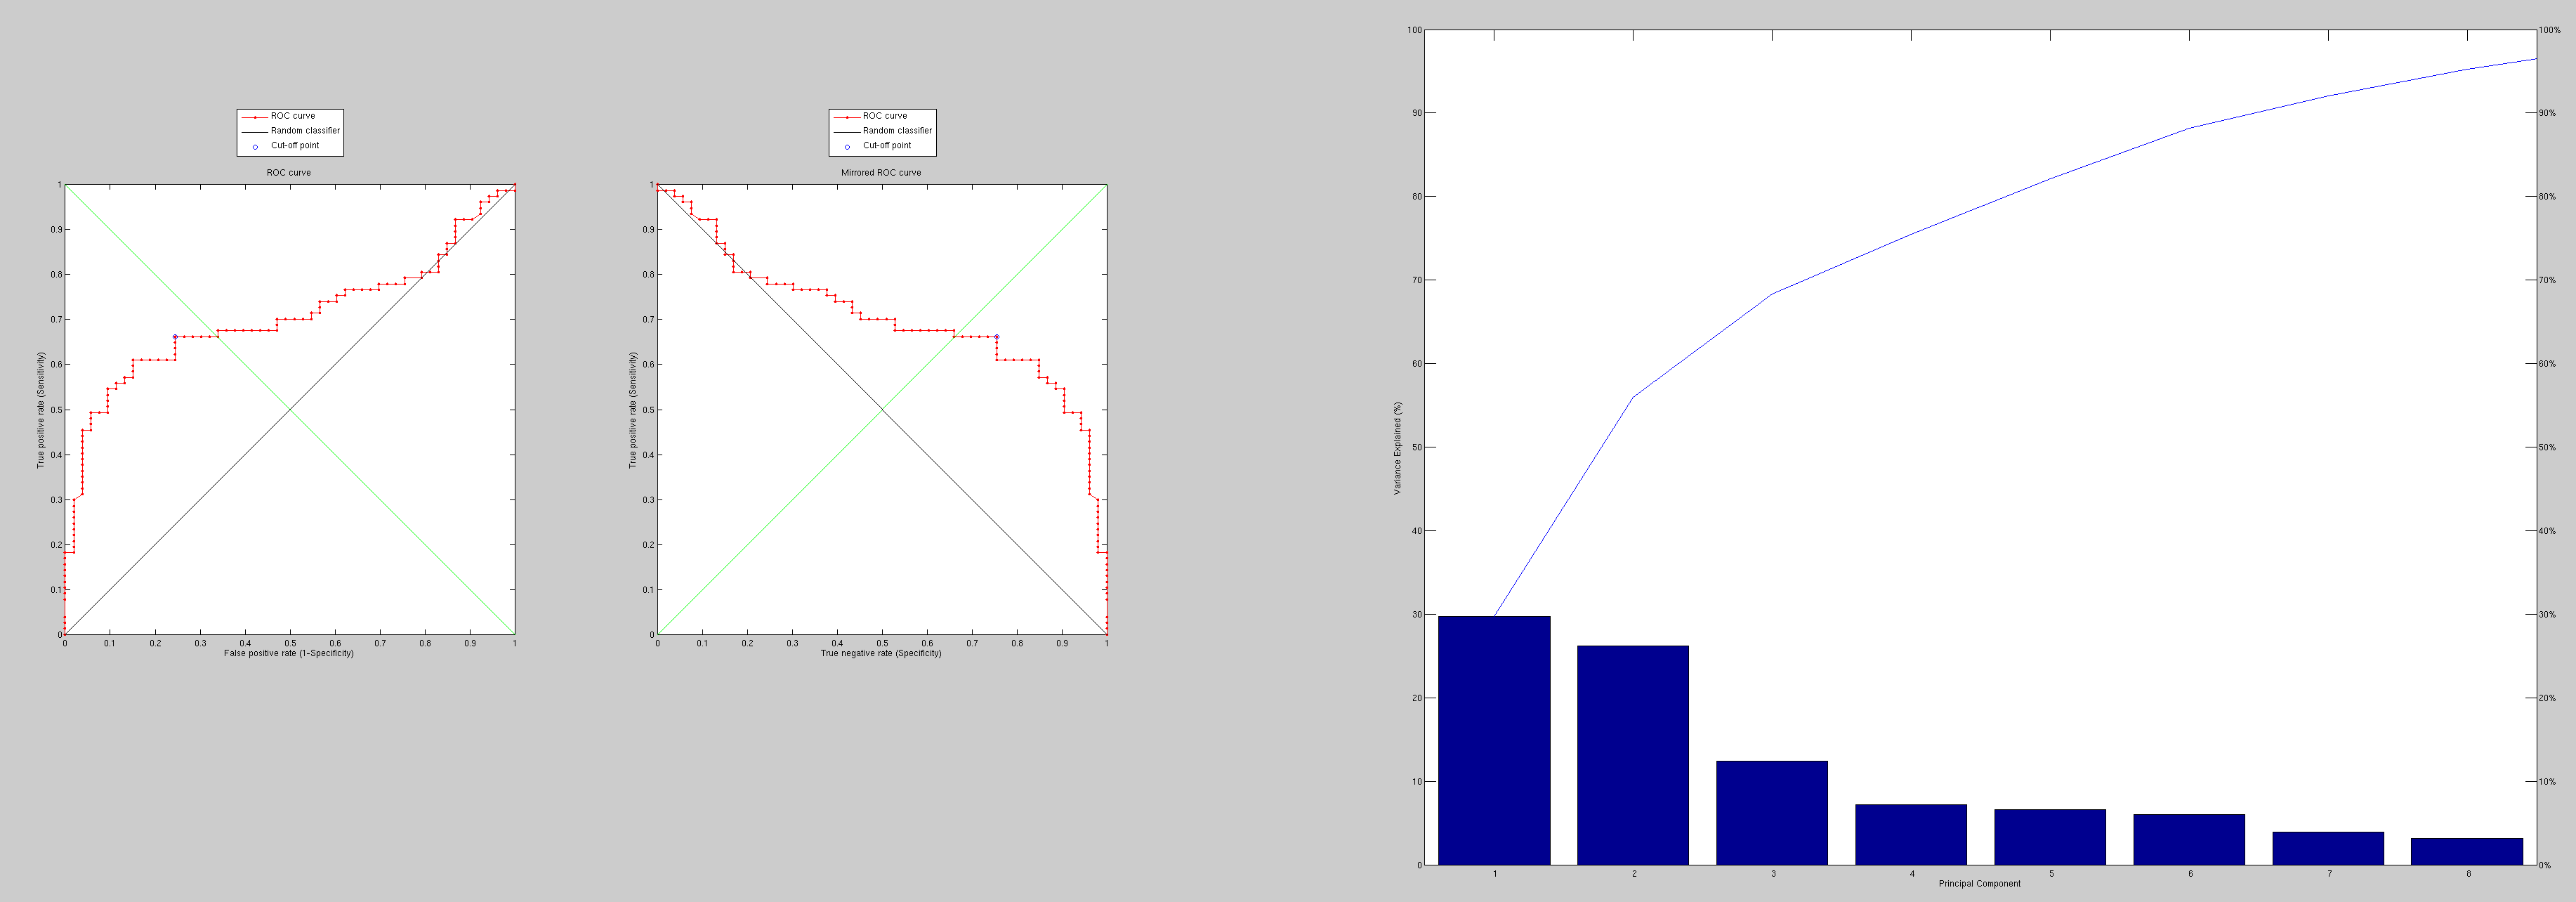
So, we first come to grips with an experiment dealing difference or residual of derivatives (initially along Y only), essentially by building a model of these. The test set is still a hard one which is not sanitised from hard cases, but it is merely used for comparative purposes here. The PCA is also not as robust as it could be, especially not to outliers.
Partial matching of faces is basically facilitated by these methods
as omission of points is possible, although it makes the observations'
length inconsistent (unknown position along one dimension or more).
Throughout the preliminary tests (Figure
and Figure ) the program mistakenly treated
the X derivative of the Y derivative as though it was the X derivative
(compare figures and ),
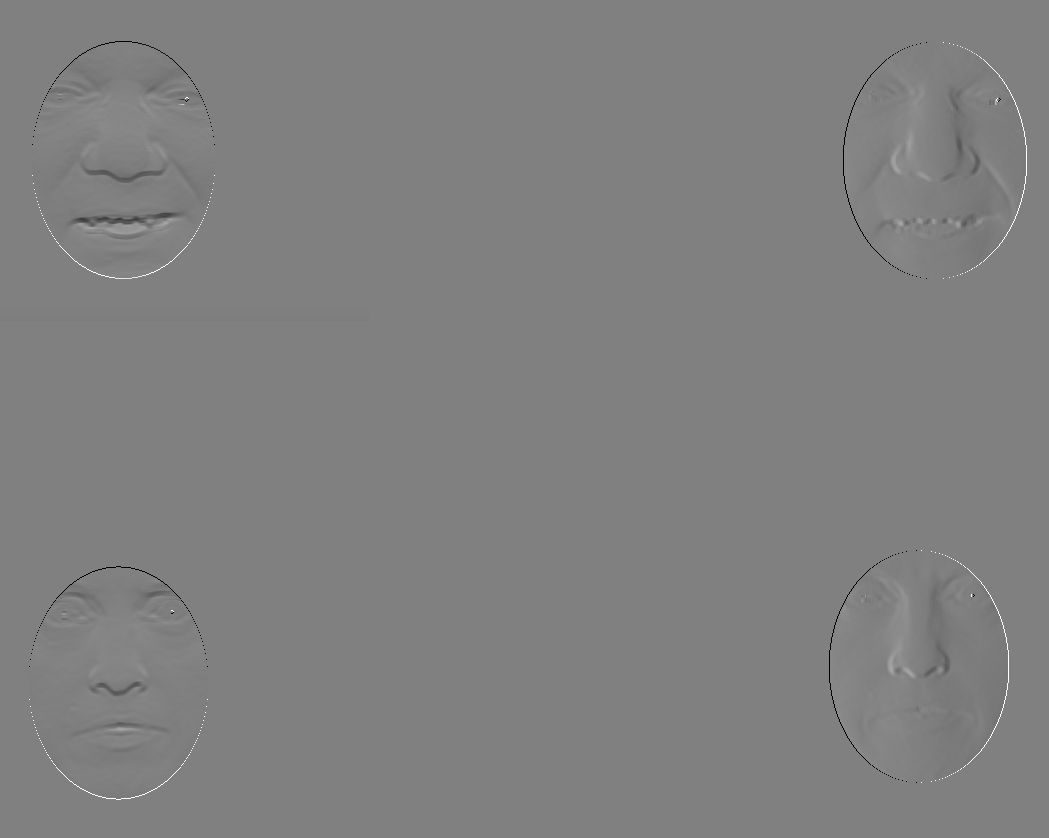
but the matter of fact is that although this approach works poorly
(no fine-tuning attempted and minimal post-processing a la
Figure ), it does help test the ground and
lay the foundations for some new ROC curves in a pipeline that supports
multi-feature PCA support, e.g. Euclidean distances fused with derivatives,
depth, and geodesic distances as measurable attributes for characterising
a surface. It would also be worth revising the PCA we use.
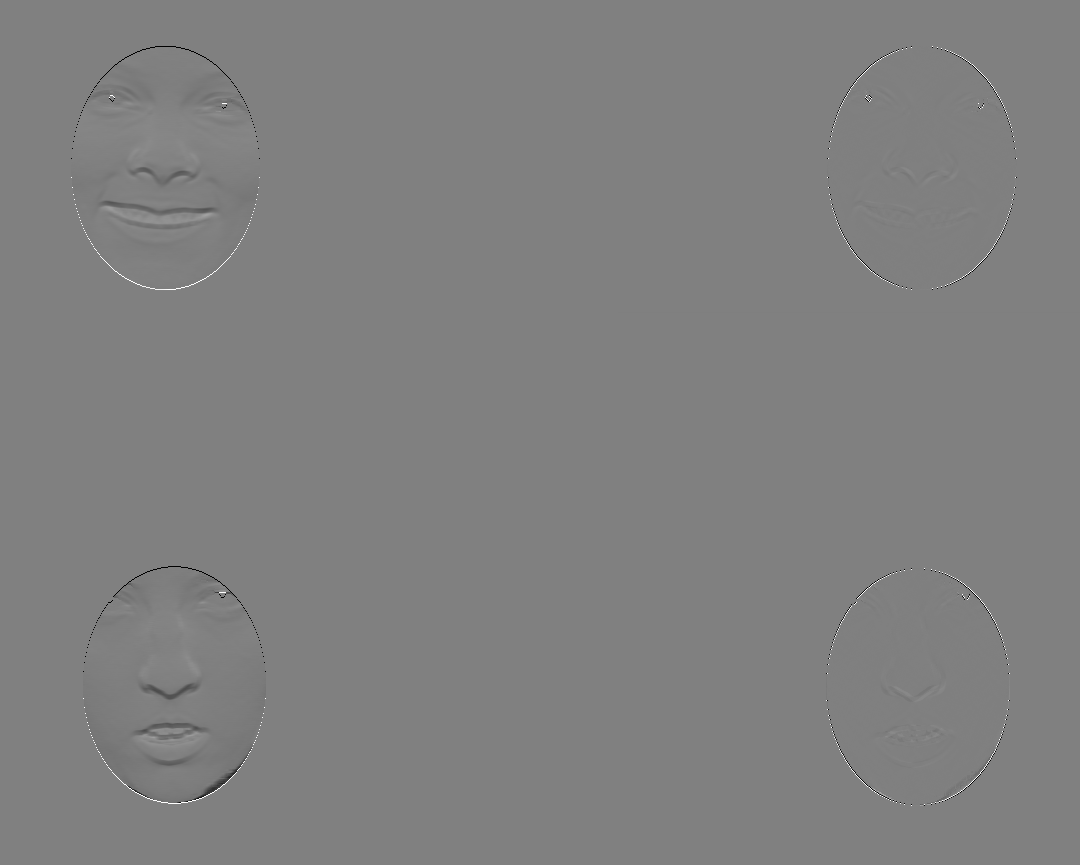
It is still implemented further so as to support two distinct features of different scale. Currently it is limited to two, but should be extensible enough in the code to support more with minor tweaks. There are also ways to get vastly superior performance, it just takes a lot longer to set up. The results here are to be treated as results from toy experiments (with bugs and unreasonable magnitudes).
|
|

|