PDF version of this document


Non-rigid registration (NRR) of both pairs and groups of images has been used increasingly in recent years, as a basis for medical image analysis. Applications include structural analysis, atlas matching and change analysis. The problem is highly under-constrained and the plethora of different algorithms that have been proposed generally produce different results for a given set of images. We present two methods for assessing the performance of non-rigid registration algorithms applied to groups of images; one requires ground truth to be provided a priori, whereas the other does not. We compare the two approaches by systematically varying the quality of registration of a set of MR images of the brain.
The first of the proposed methods for assessing registration
quality uses a generalisation of Tanimoto's spatial overlap measure.
We start with a manual mark-up of each image, providing an anatomical/tissue
label for each voxel, and measure the overlap of corresponding labels
following registration. Each label is represented using a binary image,
but after warping and interpolation into a common reference frame,
based on the results of NRR, we obtain a set of fuzzy label images.
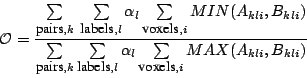
These are combined in a generalised overlap score [1]:
The second method assesses registration in terms
of the quality of a generative statistical appearance model, constructed
from the registered images - for all the experiments reported here,
this was an active appearance model (AAM). The idea is that a correct
registration produces an anatomically meaningful dense correspondence
between the set of images, resulting in a better appearance model.
We define model quality using two measures - generalisation and specificity.
Both are measures of overlap between the distribution of original
images, and a distribution of images sampled from the model. If we
use the generative property of the model to synthesise a large set
of images,
![]() , we can define
Generalisation
, we can define
Generalisation ![]() :
:
 |
(2) |
where ![]() is a measure of distance between
images,
is a measure of distance between
images, ![]() is the
is the ![]() training image, and
training image, and ![]() is the minimum over
is the minimum over ![]() (the set of synthetic
images). That is, Generalisation is the average distance from
each training image to its nearest neighbour in the synthetic image
set. A good model exhibits a low value of
(the set of synthetic
images). That is, Generalisation is the average distance from
each training image to its nearest neighbour in the synthetic image
set. A good model exhibits a low value of ![]() , indicating that the
model can generate images that cover the full range of appearances
present in the original image set. Similarly, we can define Specificity
, indicating that the
model can generate images that cover the full range of appearances
present in the original image set. Similarly, we can define Specificity
![]() :
:
 |
(3) |
That is, Specificity is the average distance of
each synthetic image from its nearest neighbour in the original image
set. A good model exhibits a low value of ![]() , indicating that the
model only generates synthetic images that are similar to those in
the original image set. The uncertainty in estimating
, indicating that the
model only generates synthetic images that are similar to those in
the original image set. The uncertainty in estimating ![]() and
and ![]() can also be computed. In our experiments we have defined
can also be computed. In our experiments we have defined ![]() as the shuffle distance between two images. Shuffle distance is the
mean of the minimum absolute difference between each pixel/voxel in
one image, and the pixels/voxels in a shuffle neighbourhood of radius
as the shuffle distance between two images. Shuffle distance is the
mean of the minimum absolute difference between each pixel/voxel in
one image, and the pixels/voxels in a shuffle neighbourhood of radius
![]() around the corresponding pixel/voxel in a second image. When
around the corresponding pixel/voxel in a second image. When
![]() , this is equivalent to the mean absolute difference between
corresponding pixels/voxels, but for larger values of
, this is equivalent to the mean absolute difference between
corresponding pixels/voxels, but for larger values of ![]() the distance
increases more smoothly as the misalignment of structures in the two
images increases.
the distance
increases more smoothly as the misalignment of structures in the two
images increases.
The overlap-based and model-based approaches were validated and compared, using a dataset consisting of 36 transaxial mid-brain slices, extracted at equivalent levels from a set of T1-weighted 3D MR scans of different subjects. Eight manually annotated anatomical labels were used as the basis for the overlap method: L/R white matter, L/R grey matter, L/R lateral ventricle, and L/R caudate. The images were brought into alignment using an NRR algorithm based on MDL optimisation [2]. A test set of different mis-registrations was then created by applying smooth pseudo-random spatial warps (based on biharmonic Clamped Plate Splines) to the registered images. Each warp was controlled by 25 randomly placed knot-points, each displaced in a random direction by a distance drawn from a Gaussian distribution whose mean controlled the average magnitude of pixel displacement over the whole image. Ten different warp instantiations were generated for each image for each of seven progressively increasing values of average pixel displacement. Registration quality was measured, for each level of registration degradation, using several variants of each of the proposed assessment methods.
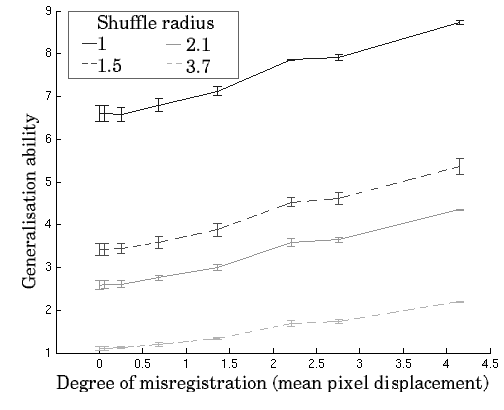
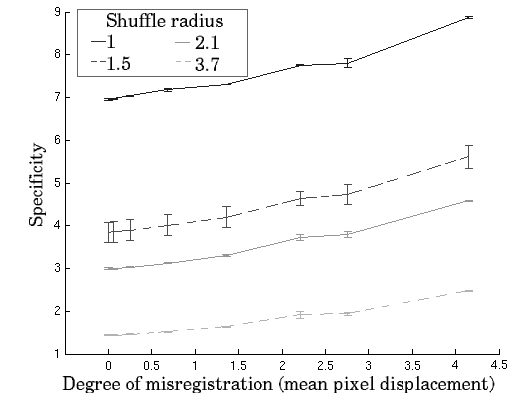

The results of the validation experiment are shown in Figure
1. Note that ![]() is expected to decrease with increasing
perturbation of the registration, whilst
is expected to decrease with increasing
perturbation of the registration, whilst ![]() and
and ![]() are expected
to increase. All three metrics are generally well-behaved and show
a monotonic response to increasing perturbation. This validates the
model-based measures of registration quality, which are shown both
to change monotonically with increasing perturbation of the registration
and to correlate with the gold-standard approach based on manually
annotated ground truth.
are expected
to increase. All three metrics are generally well-behaved and show
a monotonic response to increasing perturbation. This validates the
model-based measures of registration quality, which are shown both
to change monotonically with increasing perturbation of the registration
and to correlate with the gold-standard approach based on manually
annotated ground truth.
The results for different values of ![]() (shuffle radius)
and
(shuffle radius)
and ![]() all demonstrate monotonic behaviour with increasing
perturbation, but the slopes and errors vary systematically. This
affects the size of perturbation that can be detected. To make a quantitative
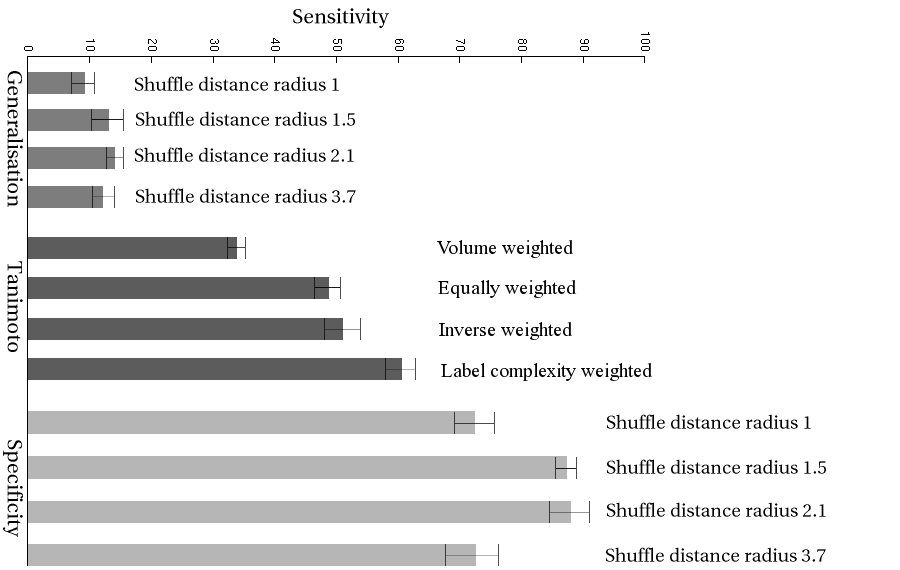
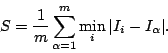
comparison of the different methods, we define the sensitivity, as
a function of perturbation as
all demonstrate monotonic behaviour with increasing
perturbation, but the slopes and errors vary systematically. This
affects the size of perturbation that can be detected. To make a quantitative
comparison of the different methods, we define the sensitivity, as
a function of perturbation as
![]() ,
where
,
where ![]() is the quality measured for a given value of displacement,
is the quality measured for a given value of displacement,
![]() is the measured quality at registration,
is the measured quality at registration, ![]() is the degree
of deformation and
is the degree
of deformation and
![]() is the mean error in the estimate
of
is the mean error in the estimate
of ![]() over the range.
over the range.
Sensitivity averaged over the range of perturbations shown in Figure 1 is plotted in Figure 2 for all the methods of assessment. This shows that the Specificity measure with shuffle radius 1.5 or 2.1 is the most sensitive of the measures studied, and that this difference is statistically significant.