PDF version of this entire document
Experiments are already being run to assess common methods of separability testing in hyperspace. Given e vectorised signature encompassing the distances we deem meaningful in a given set, it remains to be determined how exactly to measure that clustering of them in a high-dimensional space, determining whether or not they fit within a particular cloud of one person or simply lying outside of it (thresholds and decision points can be appropriately adjusted, even by adding GMDS as a separate discriminant). Mahalanobis distance, Hotelling's T-square distribution for multivariate statistical testing and Fisher's Linear Discriminant Analysis can help here, but simpler units of distance are being tested first for some insight.
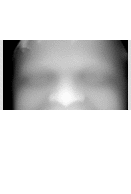
Scripts were produced to turn a sequence of images into an animation of small size that provides insight into variability of surfaces on which geodesic measures are taken. For particular cases, detection is made harder by motion around the eyes (including closure), but this is one of the caveats of dealing with surfaces of these kinds.
|
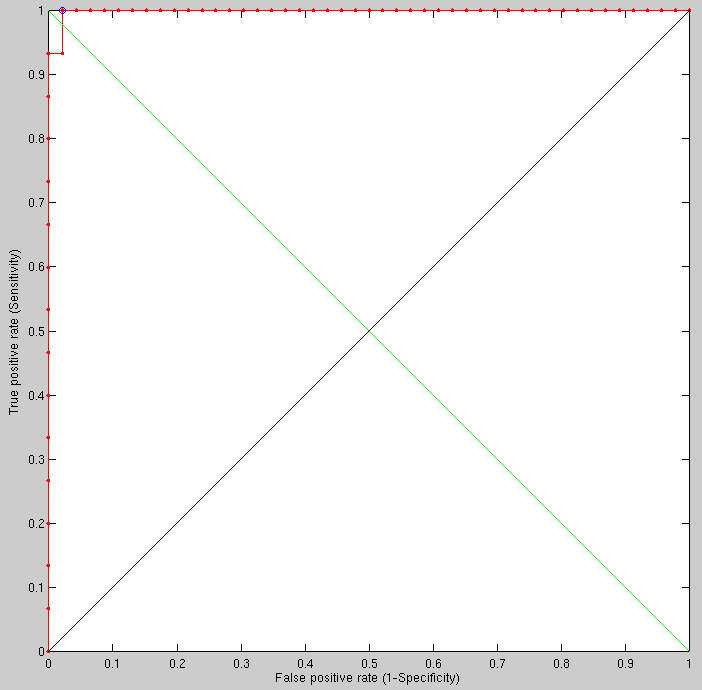
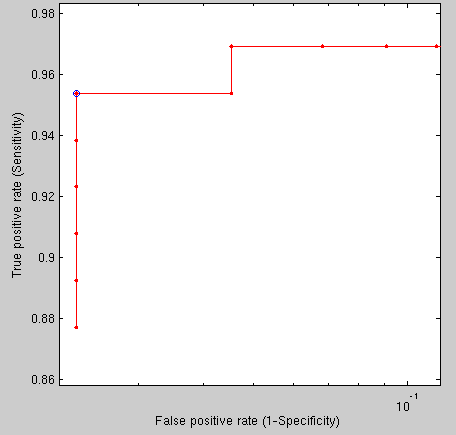
Taking the first imaged individual vs different imaged individuals
(92 different individuals), the following results are obtained using
the new method, which is still being refined and adjusted to the task
at hand (Figure ![[*]](/IMG/latex/crossref.png) ).
).
|
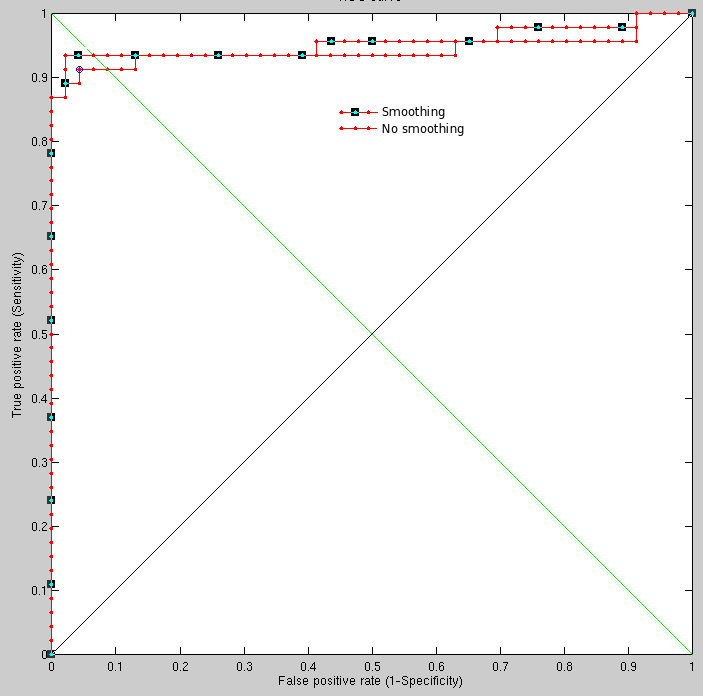
The animations show the already-aligned surfaces, which my method needs to deal with (as shown in the animations) and then detect as identical. It is not always easy, but I apply a lot of smoothing to annul the effect of variation inside the eyes, for instance. Perhaps selective smoothing (localised) would yield better results and it is definitely something worth studying in overnight experiments. In very large experiments there are some rotten apples that are clearly outliers (wrt to other images in the same set), weighing an order of magnitude more than the rest. I don't remove them from the results. Ideally, using multiple classifiers would help just eliminate this issue (this has not been attempted or tested yet). There is a need to code 'around' them because they stand out like a sore thumb.
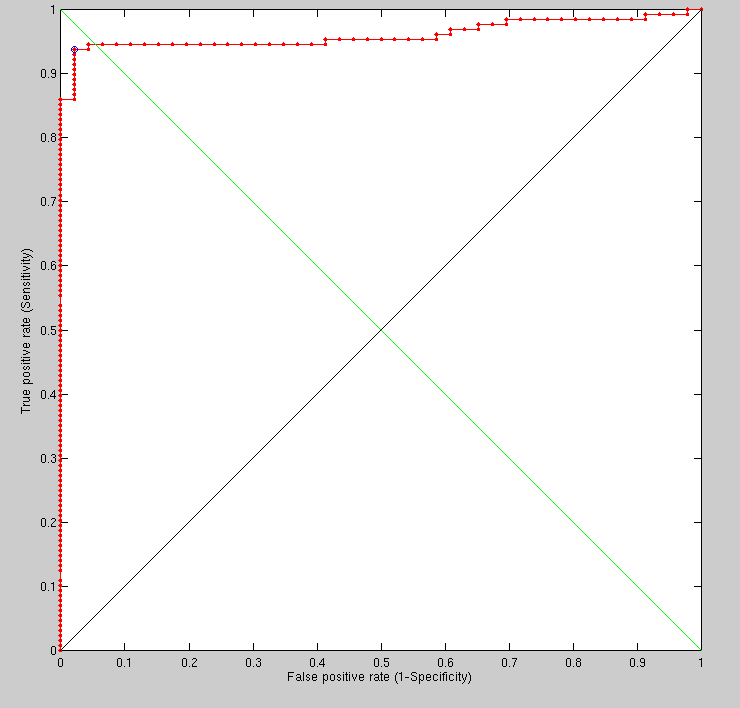
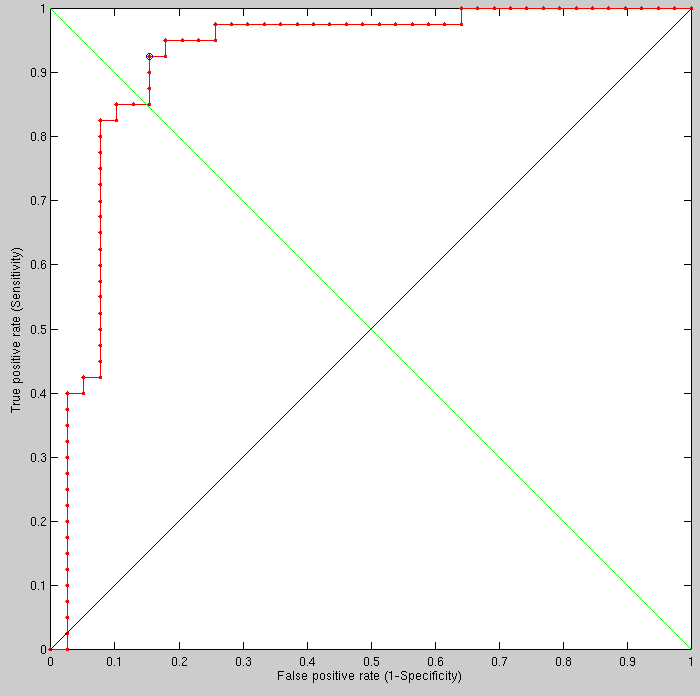
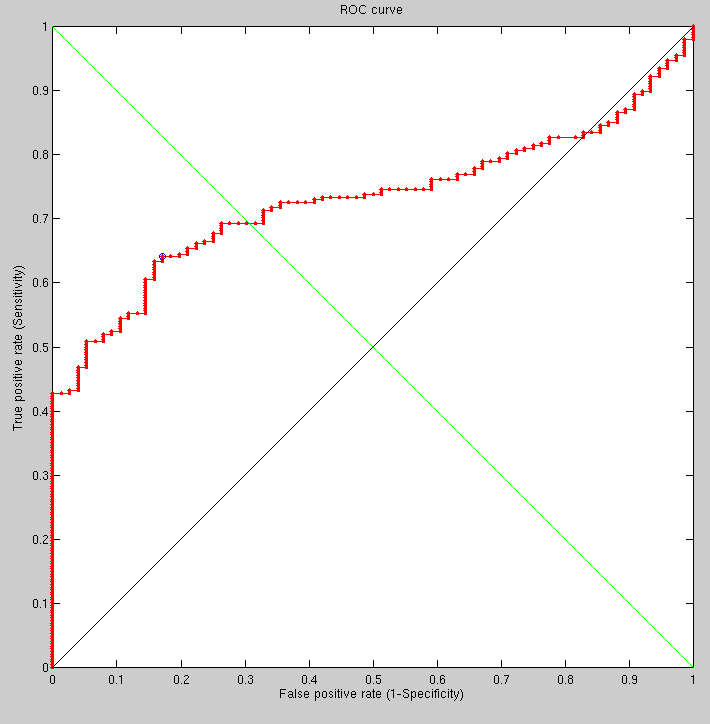
Taking half a dozen random people and applying to them the same method applied previously (to one one versus 92), the ROC curve is not too bad, but there is plenty of room for improvement, especially by addressing the characteristics of outliers. Maybe a multiple classier approach would also come handy here, essentially utilising two separate methods each of which giving a high degree of accuracy.
By running analogous experiments with all data, seeds and methods in complete alignment with the exception of smoothing (moving, 13 pixels wide) we are able to see slight improvement incurred by the use of smoothing in the new FMM-based method. It makes sense to do this around the eyes, but currently the filter is applied uniformly to the entire image.
We found an error in our metadata, which caused the reported recognition rates to be slightly worse than they ought to be. This came up when investigating those aforementioned outliers. The algorithm did just what it was supposed to do; it was the expectation which was erroneous. Tessellation density will now be increased somewhat to test its ability to help discern identities. This is generally progressing at an encouraging pace with a solution based on FMM which is tailored to the task at hand (rather than something more general-purpose like GMDS, where stringency and leniently are generally hard to balance against each other).
One caveat of this approach is that by measuring Euclidean distances upon something when moves anatomically in non-rigid parts of the face this approach will become sensitive to narrowing and expanding parts. For instance, when smiling one's cheek may move up and down a bit. From a geodesic point of view this may not be a problem, but when this is then measured in a Euclidean way the distances will change although it is the same person imaged. Raising of one's eyebrows might cause similar issues and some of the hardest images (which are most helpful for meaningful comparison testing where errors need to be common) have this sort of variation in them. This is perhaps why combining this approach with GMDS would be useful. This has not been attempted yet.
|
|
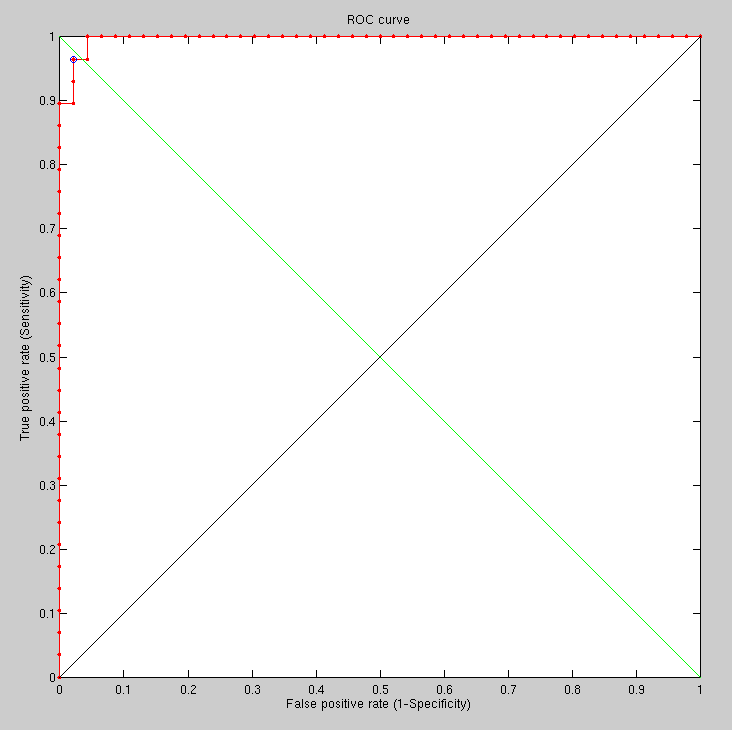
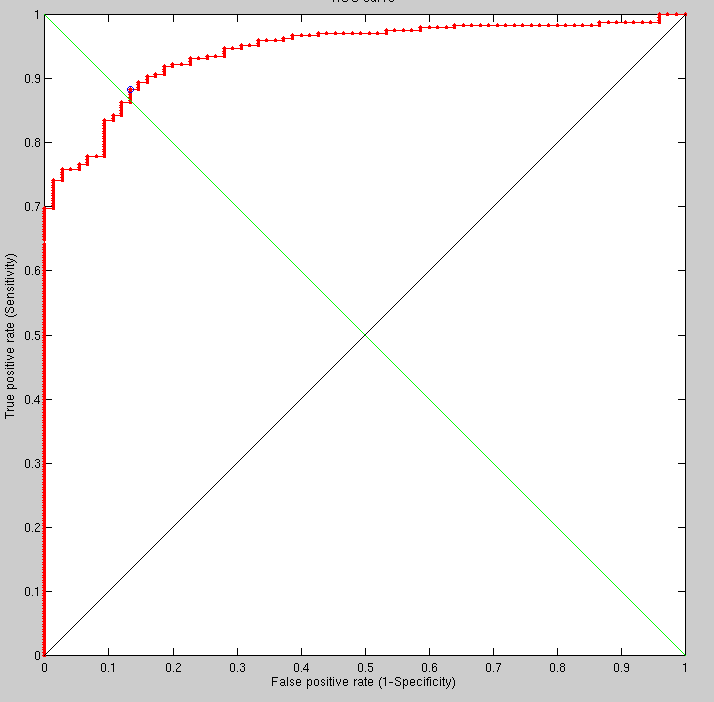
Having increased the 2-D smoothing scale from 11 to 19 (to verify that excessive smoothing eliminates the signal) we get the expected outcome. The results shown in the ROC curves were obtained within hours. It will be interesting to try a few more values (smoothing-oriented) to test what is optimal given other choices of other free parameters (everything is inter-dependent).
|
The increase in smoothing window dimensions (from 13x13 to 19x19) was not chosen just to see the effect on performance but also to understand to what degree we can eliminate the artifact of eyes closing, opening, and moving in ways that affect the geodesic distance measures in that area.
Drawing a colour map to visualise areas of distance mis-correspondence might be the next logical thing to implement as coding this might help see where and why there are errors. It is possible to do more work on this if it's seen as vital at this stage or at a later stage.
Attempting to show how it extends to a larger database would be interesting. It would help smoothen the existing ROC curves and potentially integrate with another classifier. One option would be running an experiment that simultaneously uses both GMDS stress and Euclidean distances to do the scoring, then make a decision based on multiple scoring criteria. 1,000, 10,000, or even more pairs than that can be put together for the purpose. This can take days to run, so careful attention is required throughout experimental design (getting more results would possibly require a rerun). The upside is, the results can be shown cumulatively, refined over time as the experiment goes along.
GMDS and my new method tend to produce values that are not so far apart, but they do occasionally deviate and diverge. There is a close tie and a strong correlation between the different measures where the images are, in fact, prone to be difficult. 3 classifiers (or more) can be used in a fashion that makes expanding the set size trivial.
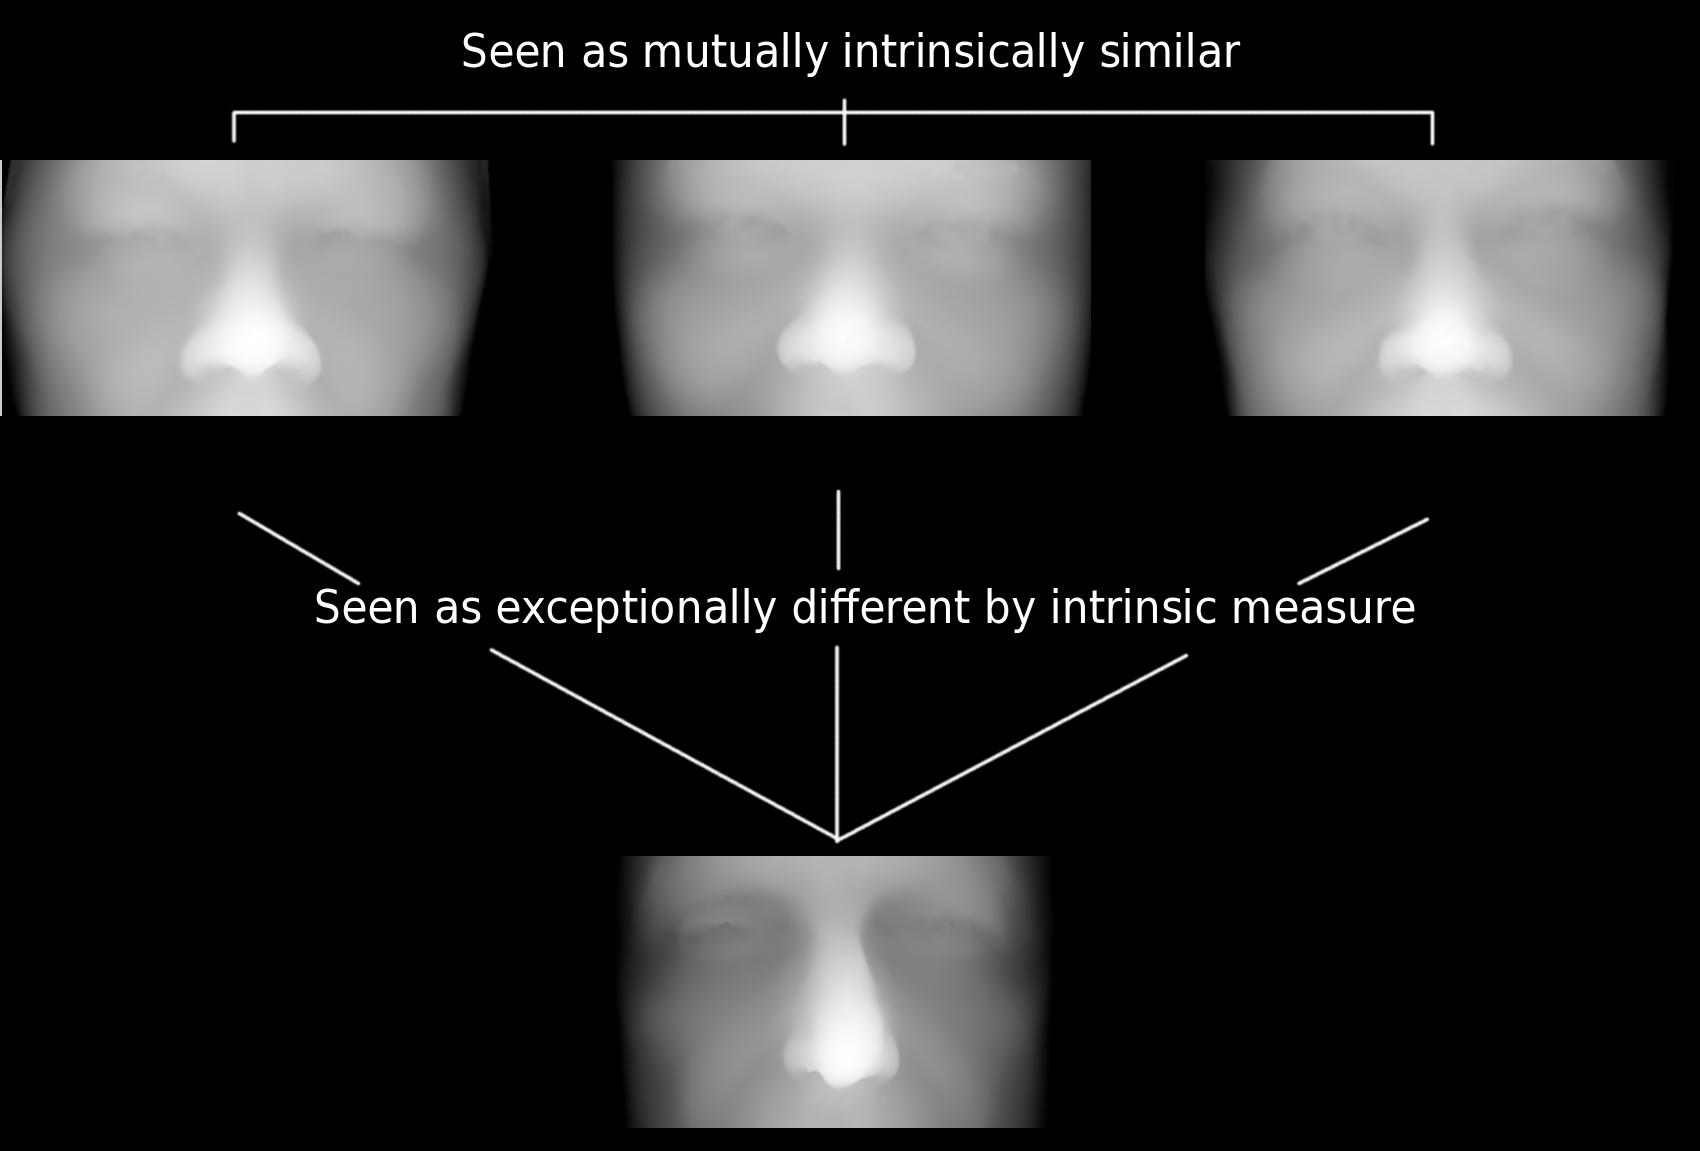
Experiments have begun which expand the size of our gallery of false pairs, where images are also being understood along the way if errors arise. Some or these errors cannot quite be discerned by the human eye based on mere observation, i.e. looking at 3-D data alone. By limiting the scope to rigid parts of the face (mostly eye and nose) we rid ourselves from challenges of deformity but at the same time discard much of the signal. The following image provides a real example of the dilemma being faced.
|
Both my method and GMDS struggle to tell apart those 3 images to a sufficient extent and it is usually the source of the only error seen in some ROC curves shown priorly.
in Texas University, based on their recent papers, they have classifiers with similar recognition rates being put together to attain about 98% recognition rate (overall, as the pertinent classifiers hover around 95%).
To demonstrate edge cases that produce some errors, the selective gallery shows 3 images that are as mutually intrinsically similar and the same three which are seen as exceptionally different based on intrinsic measure criteria. A lot of time was spent reassuring that there is no bug there or an easy tweak to parameters which would overcome this without also negatively affecting other pairs. Any tweak made may take a lot of work to understand because regenerating ROC curves takes a considerable amount of time and effort.
In the figure of cropped faces, the top line looks similar to an observer and different from the bottom, which is what we expect, i.e. one would have classified it as such. These are really boundary cases that probably have to do with missing (occluded) parts of the nose that we interpolate for, while others apply more sophisticated tricks.
With an expanded list of image pairs (about 600, added semi-manually earlier on), both servers are running and producing results of comparisons, where so far the method is: use GMDS as primary, FMM+Euclidean distances as a fallback for borderline cases (those first two could be reversed), and other Euclidean methods (e.g. simply surface-to-surface comparators) can be used as secondary fallback in case the first two cannot return a definite answer (adjusting the threshold may be observation-based), i.e. the answer lies within the borders of uncertainty, based primarily on geodesic methods. Results will be shown cumulatively and the method revised along the way if it is found to be in inferior to another. There are more principled and formal ways of combining these, but they can be explored later (optimising weights for performance). The resolution currently used is not high and the smoothing filter has a window of size 13x13. This could be improved at the expense of speed.
Experiments were run on about 1,000 images (using two servers) but unfortunately with a coding error in the simulation (it's because GMDS measured distances upon just a small region in all cases). For the sake of testing, everything will be kept coarse in the rerun as it is possible to increase the resolutions to improve performance at the expense of speed at a later stage.
Salvaging some results from the error is possible. There are lessons to be learned also from the bug, for instance the fact that sub-parts of the image are not good enough classifiers, which means that we depend on combining several.
The settings at the moment are, there is a 0.3-0.9 range that invokes fallback for my FMM-based method, with another threshold for exceptional errors (I also tried a 0.5-0.9 range for fallback), but the analysis given by GMDS would not be handy until the experiments are rerun correctly. If GMDS also fails to produce a definite answer, then we use a poorer measures or simply announce that no decision could be made reliably (passing rather than making an erroneous guess).
|
|
|
Roy Schestowitz 2012-01-08