PDF version of this entire document


A multi-feature *PCA approach is being embraced and a suitable algorithm
is being put into the same framework as before. For testing and debugging
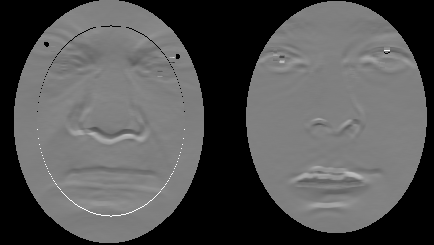
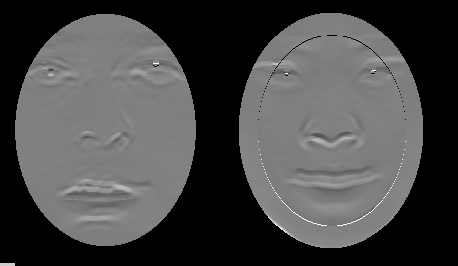
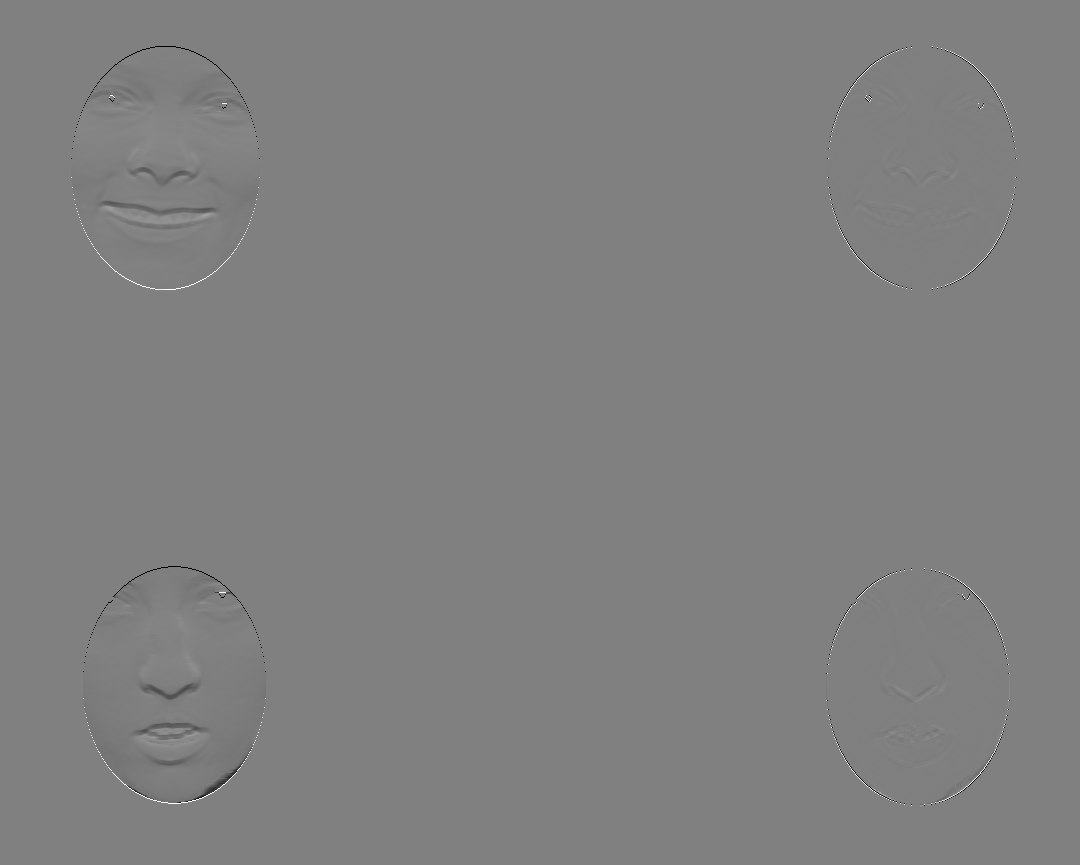
purposes, X and Y derivative images are being calculated (estimating
depth differences in the face, from a frontal perspective). See figures
![[*]](/IMG/latex/crossref.png) and
for visual examples.
and
for visual examples.
A closer look at the SVN repository revealed nothing relevant that can intuitively give MDS-esque matrices, but that too will be added. The foundations must be laid down and debugged first.
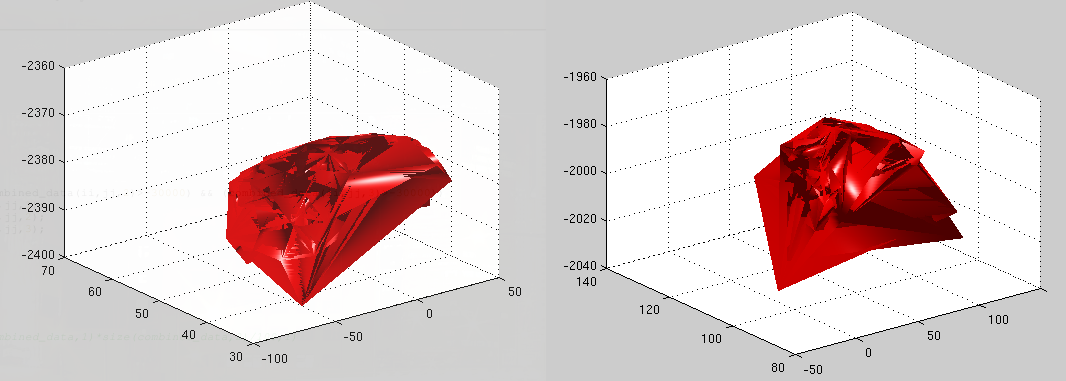
For each of the two surfaces, S and Q, the steepness of points along the Z axis can indicate the degree of curvature and irregularity, although distances are absolute and unless measured with a signed value, they will not convey information about directions. To measure this more properly we may need to travel on/near the surface and perhaps even interpolate to measure those distances more properly, namely in a way that preserves invariance properties. This effect will be studied shortly. The imminent goal is for PCA to be applied to the GMDS-esque geodesics matrix, which is a concise representation or coding of a face, mostly invariant to pixel-wise difference and motion of parts in connected tissue.
As a first stage, we take the X and Y derivatives (gradient) and consider these as implicit shape descriptors. To be more precise, we use derivative images with smoothing of radius 6 to have a sense of direction to be used as an identifier, not necessarily expecting it to be a valuable discriminant. This image is being smoothed because of the sparse sampling on a grid (8x8 points apart, which make up about 150 dimensions).
One could argue that the equally sampled set of curvatures provides insight into the spatial information in a way that is hardly affected by length of nose relative to the face, for example. Using a fusion of both might also be worthwhile, e.g. a combined PCA model of depth and curvature and/or geodesic/Euclidean distances.
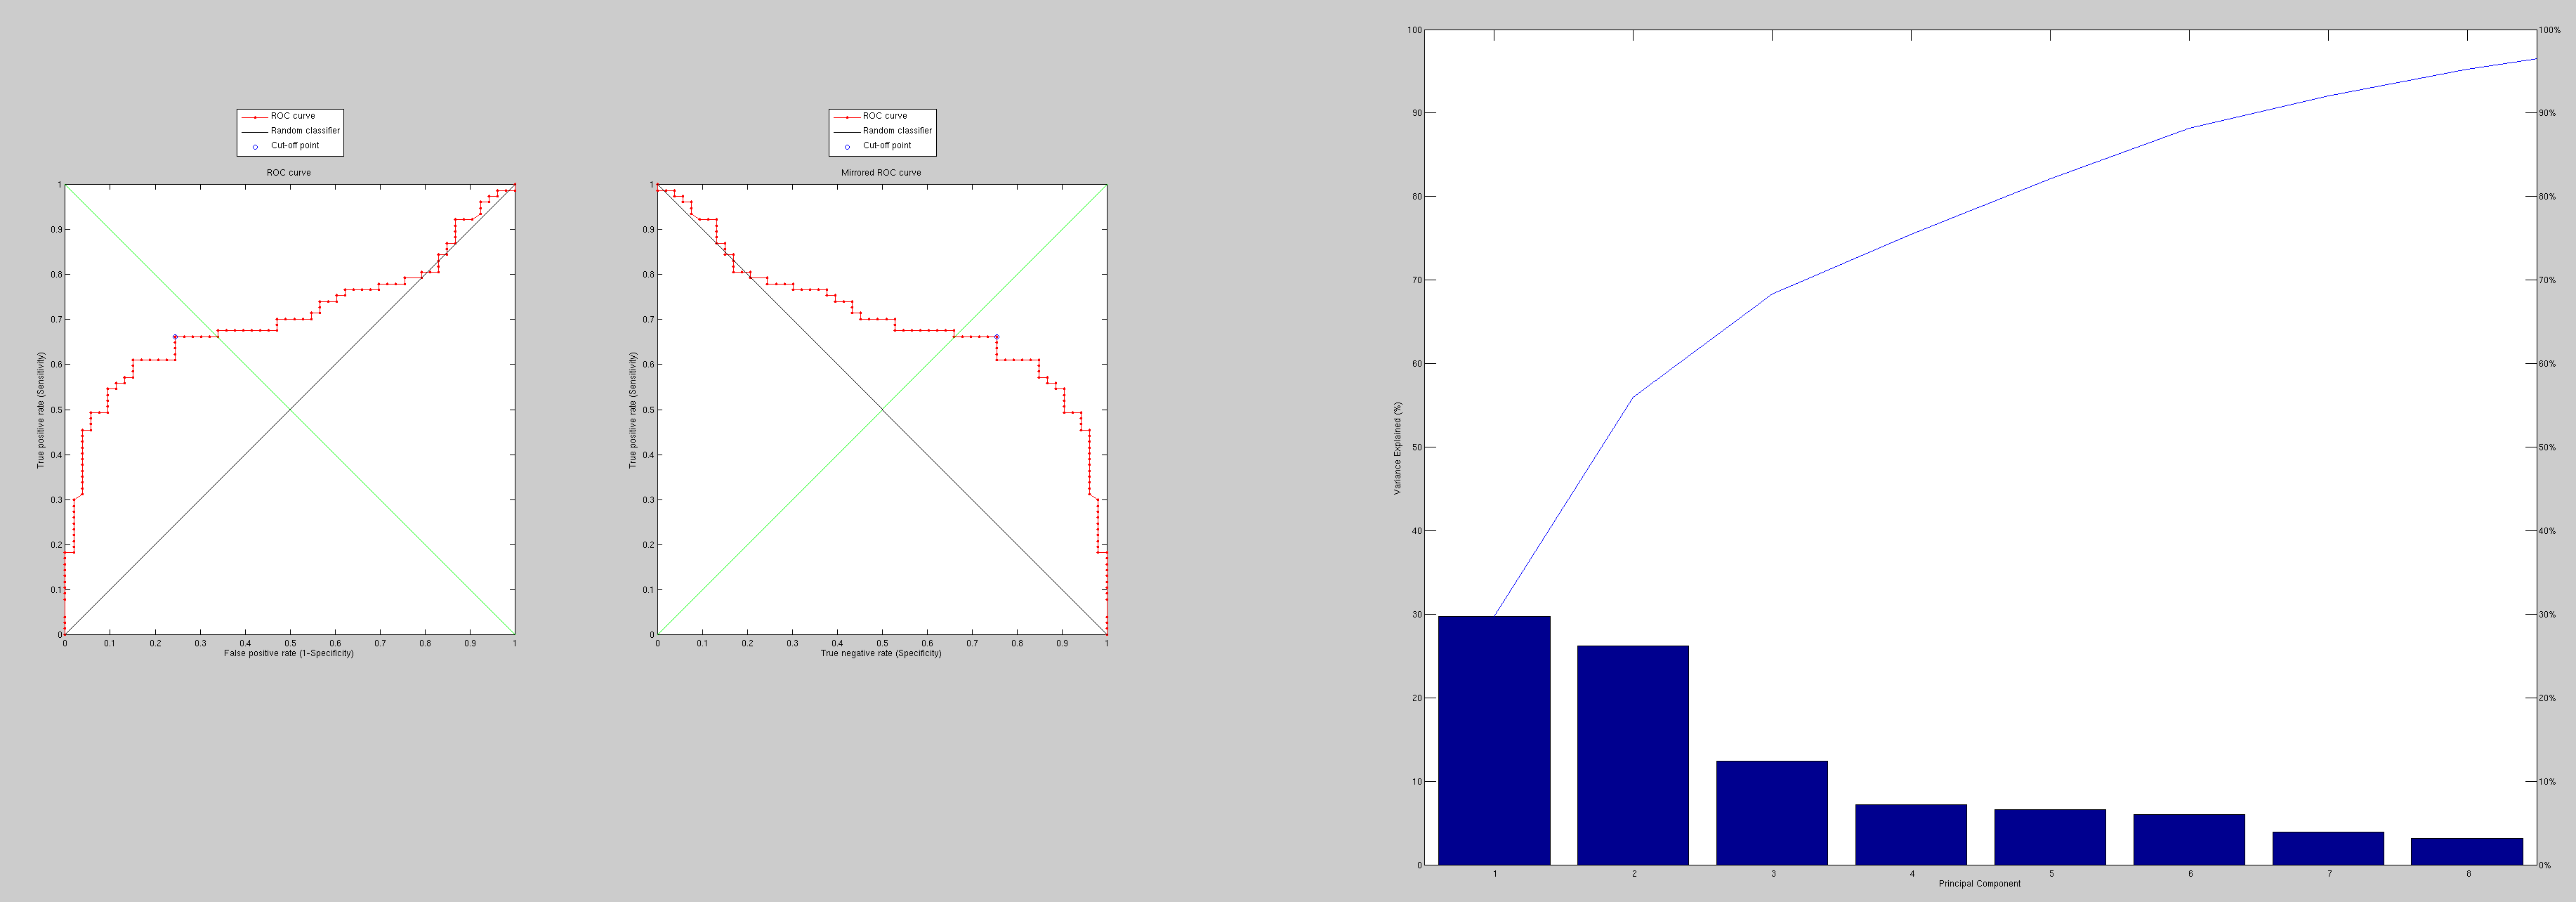
So, we first come to grips with an experiment dealing difference or residual of derivatives (initially along Y only), essentially by building a model of these. The test set is still a hard one which is not sanitised from hard cases, but it is merely used for comparative purposes here. The PCA is also not as robust as it could be, especially not to outliers.
Partial matching of faces is basically facilitated by these methods
as omission of points is possible, although it makes the observations'
length inconsistent (unknown position along one dimension or more).
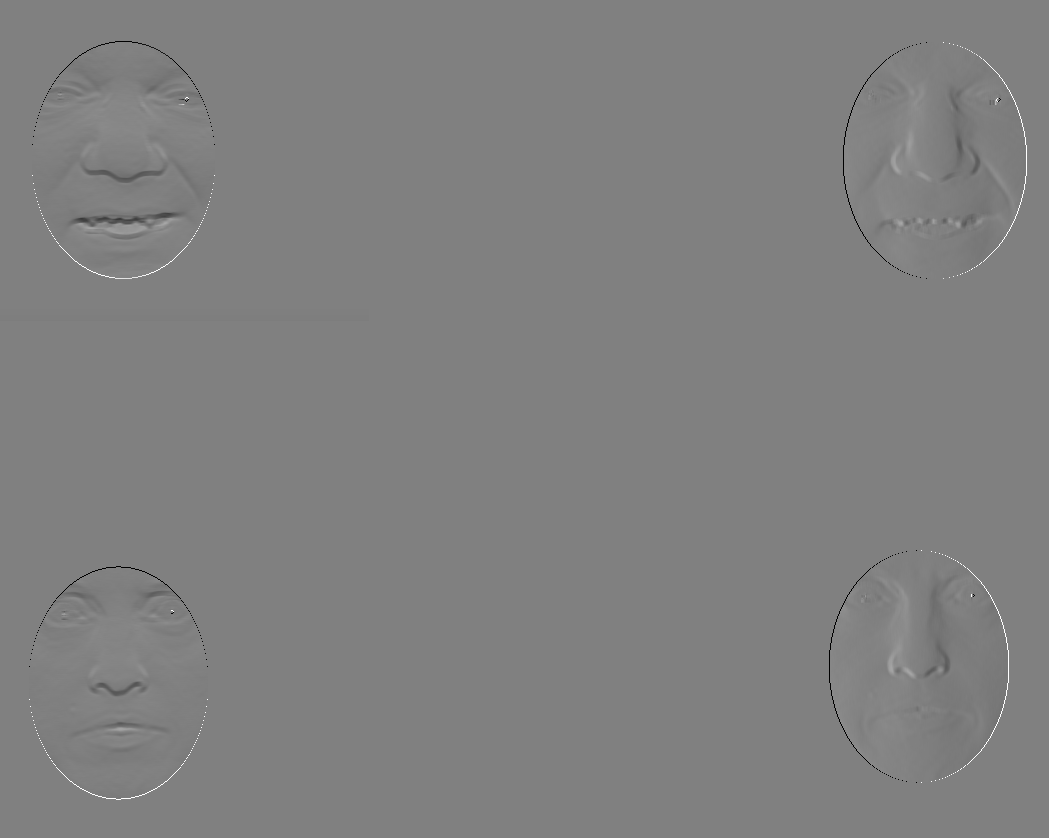
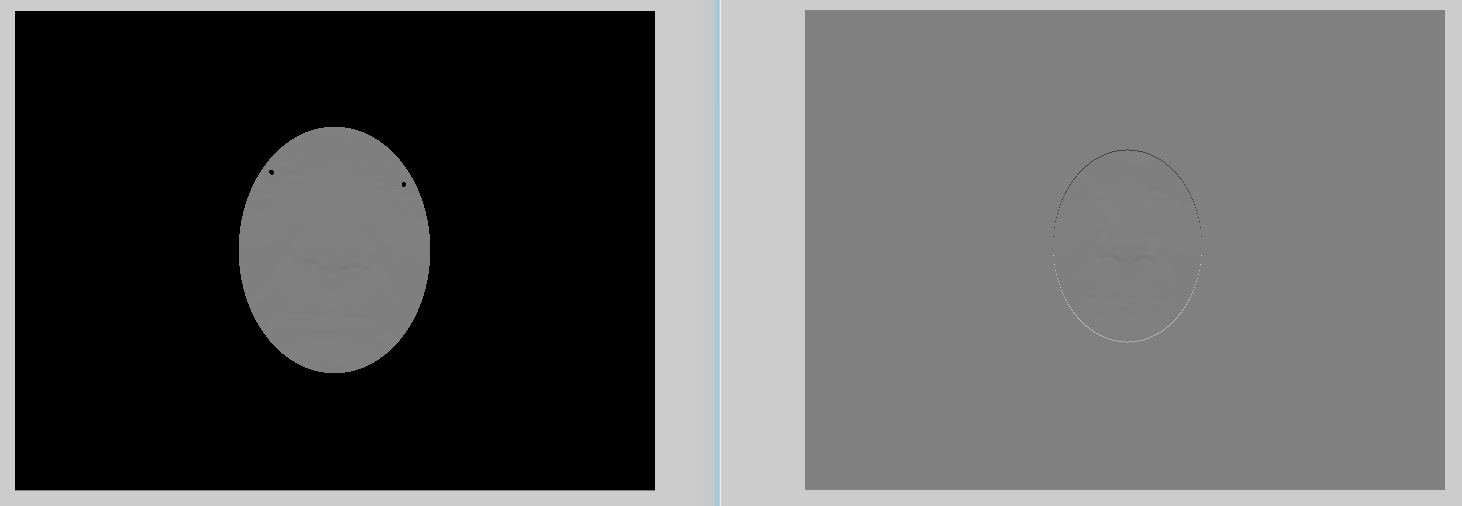
Throughout the preliminary tests (Figure
and Figure ) the program mistakenly treated
the X derivative of the Y derivative as though it was the X derivative
(compare figures and ),
but the matter of fact is that although this approach works poorly
(no fine-tuning attempted and minimal post-processing a la
Figure ), it does help test the ground and
lay the foundations for some new ROC curves in a pipeline that supports
multi-feature PCA support, e.g. Euclidean distances fused with derivatives,
depth, and geodesic distances as measurable attributes for characterising
a surface. It would also be worth revising the PCA we use.
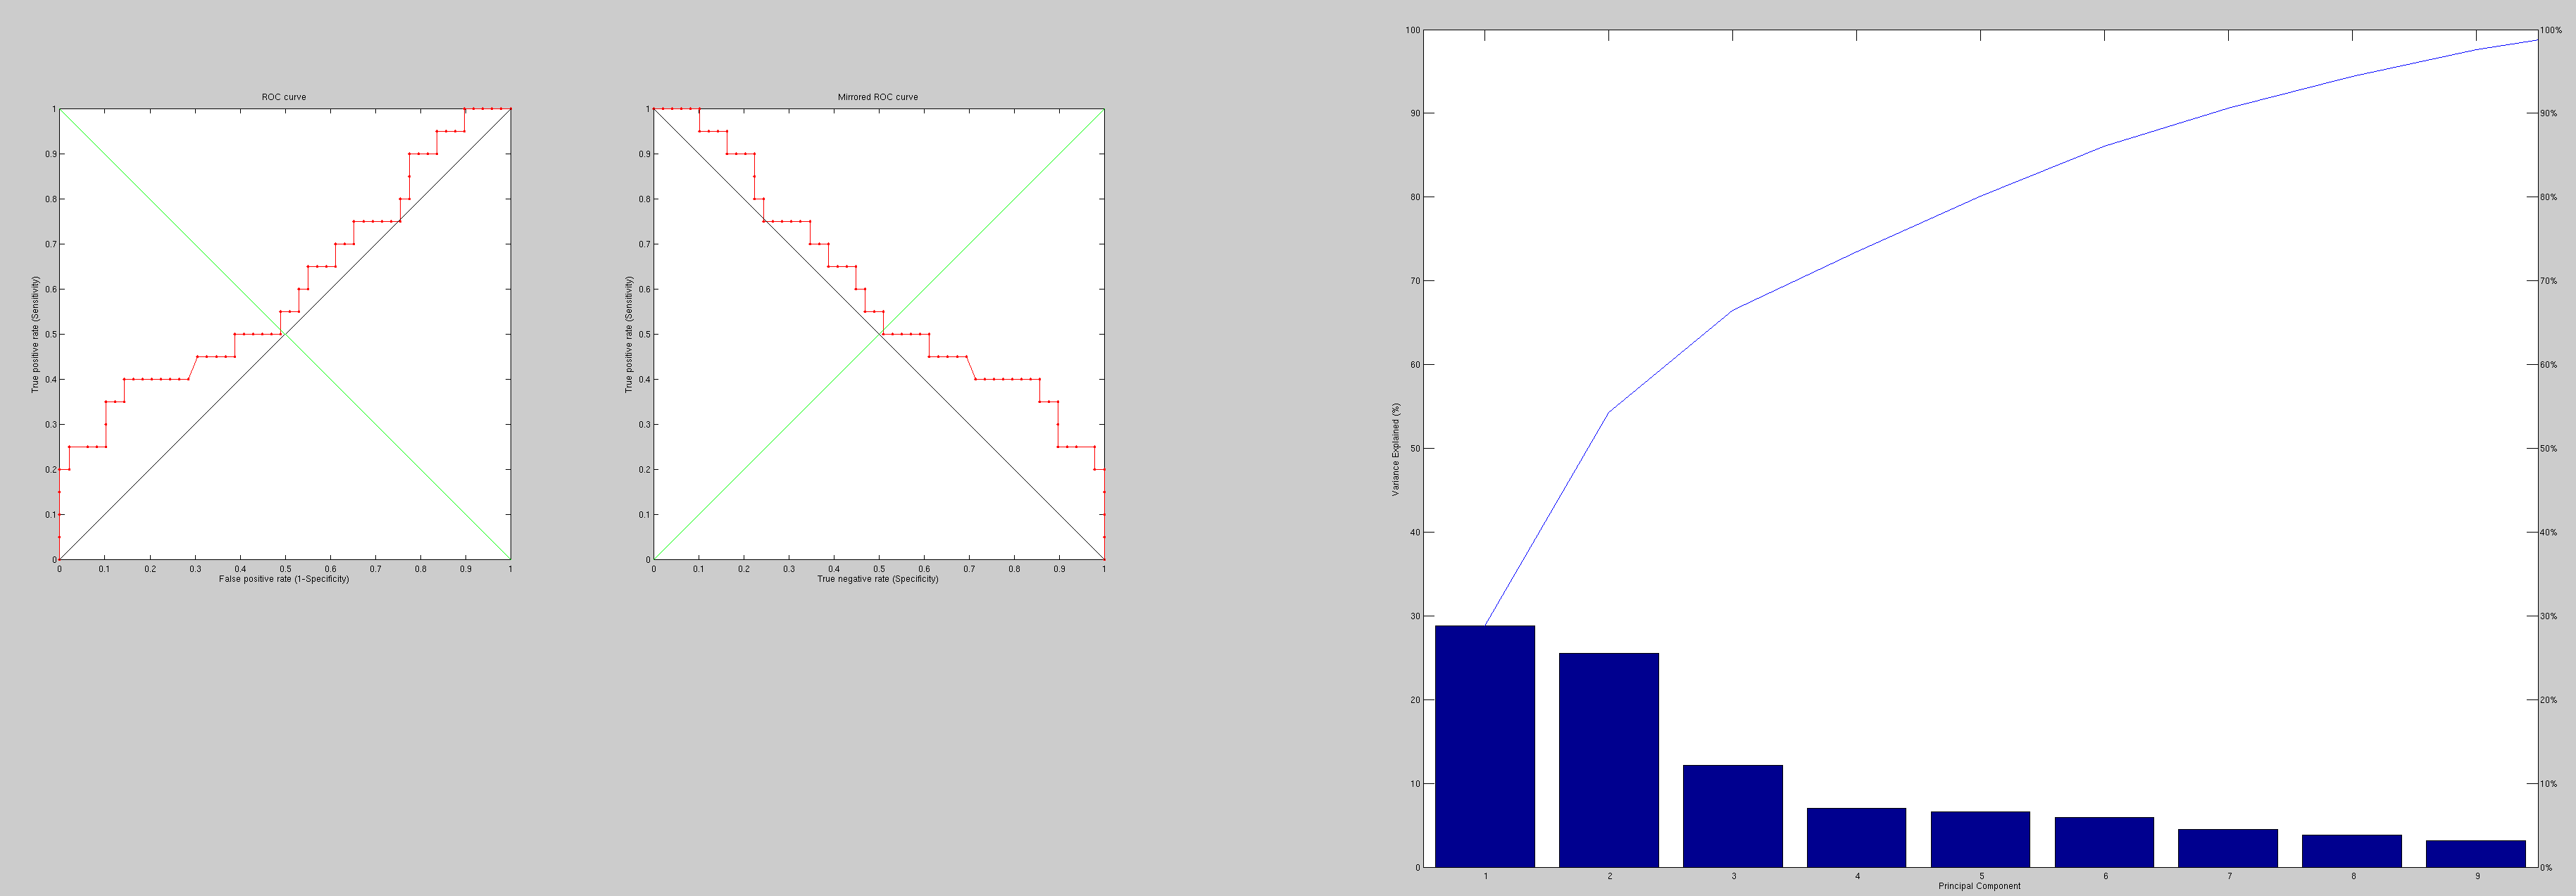
It is still implemented further so as to support two distinct features of different scale. Currently it is limited to two, but should be extensible enough in the code to support more with minor tweaks. There are also ways to get vastly superior performance, it just takes a lot longer to set up. The results here are to be treated as results from toy experiments (with bugs and unreasonable magnitudes).
|
|
|
With previous bugs removed, derivative-based descriptors were used
with plain PCA to get the performance shown in the ROC curve (Figure
). There is some certain correlation between
the smoothed derivatives and the Euclidean distanced between points
placed on a fixed grid in both surfaces, but there are far better
measures that find meaningful correspondence (e.g. areas of high curvature)
and measure the distance along the surface on inside the volume.
|
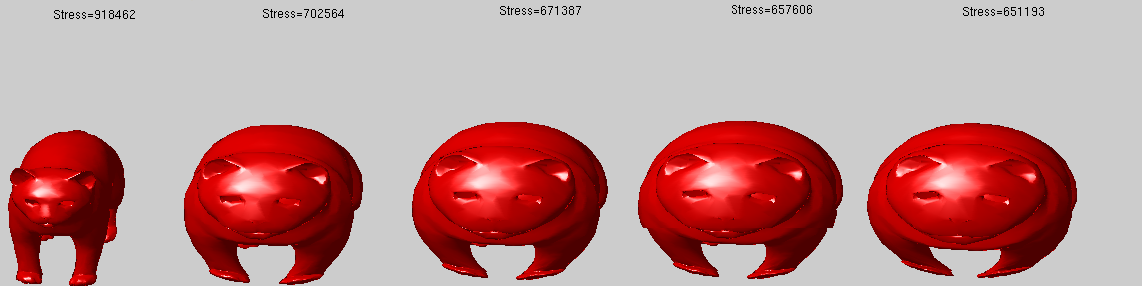
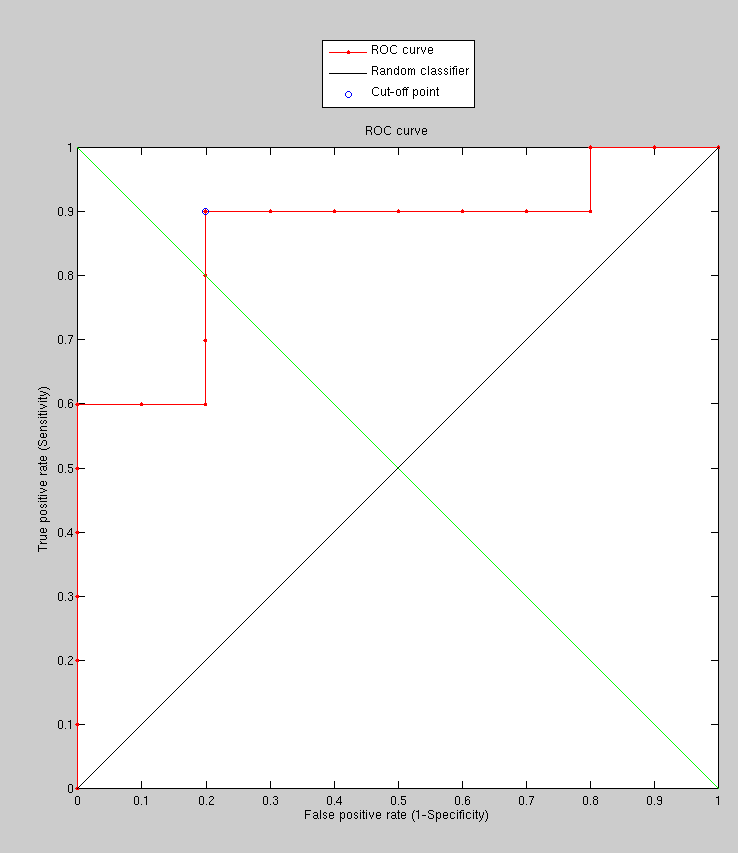
Taking a similar approach and applying it with robust PCA and multidimensional
scaling (MDS) distance matrices, the early steps can involve stress
reduction, as seen in the example in Figure .
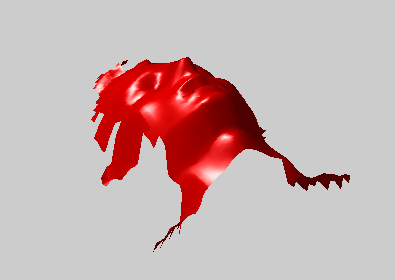
The faces have partial similarity and very dense resolution. We can
sample them 10 points apart (as shown in Figure ),
then smooth and triangulate. By applying these to faces and then building
a table of distances (optionally with stressed minimised) these faces
can be put in a frame of reference within which they can be compared,
e.g. using a variant of PCA.
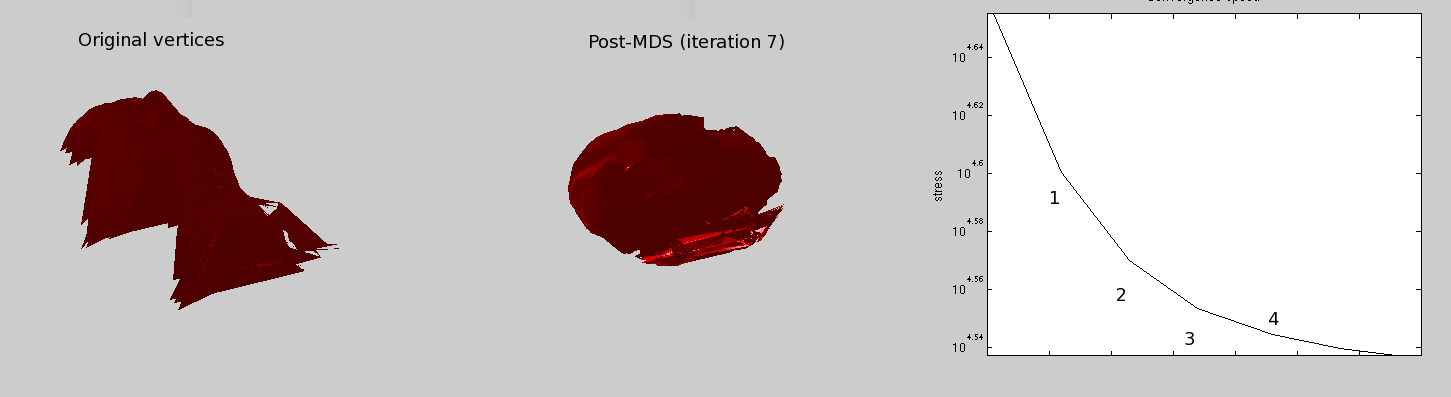
We need to select a sort of tessellation for triangles that define distances, e.g. for barycentric triangulation of generalised distance maps. Then, finding canonical forms for each pair of faces and matching those forms (or measuring their isometric properties) may help provide ordered measure/s for PCA. It's non-trivial where faces do not have geometric correspondences. Experiments were done on some test data where the triangulation is dense and pre-supplied. For partial matching where the number of corresponding points is unknown, ordering becomes tricky. It should probably be safe enough to just sample in areas of interest inside the faces, probably where it is abundantly clear data will always exist, i.e. not near edges of the face; rather, near the centre, the eye, the mouth, and so on.
The picture in Figure could be shown
in the form of an animation, characterising the optimisation of point
distances and relocations (compare to random in Figure ).
Instead, a curve leading toward convergence is shown along with the
starting point and ending point where triangulation is very poor.
Ideally, nearly points ought to be connected to neighbours and it
is likely that a wide variety of algorithms exist for achieving it.
Any preference may bias the results.