


Next: Experimental Evaluation
Up: Appearance Model Evaluation
Previous: Specificity
Measuring Distances Between Images
The most straightforward way to measure the
distance between images is to evaluate the mean absolute
difference between them, or alternatively treat them as vectors by
concatenating pixel/voxel values and take the Euclidean distance.
Although this has the merit of simplicity, it does not provide a
very robust distance measurement. In the context of model and
image registration evaluation considered here, these approaches
result in measures of distance that increases rapidly, even for
quite small image misalignments. Robustness can be enhanced by
considering a `shuffle distance', inspired by the `shuffle
transform' [15]. The idea is to seek correspondence with
a wider area around each pixel. Instead of taking the mean
absolute difference between exactly corresponding pixels, we take
each pixel in one image in turn, and compute the minimum
absolute difference between it and pixels in a shuffle
neighbourhood of the exactly corresponding pixel in the other
image. This approach is less sensitive to small misalignments, and
provides a more robust measure of image distance. The sensitivity
to misalignment is determined directly by the size and shape of
the shuffle neighbourhood. One obvious choice is a square box
around the corresponding pixel, but this is inherently
anisotropic. Instead, we consider a shuffle disc, of radius 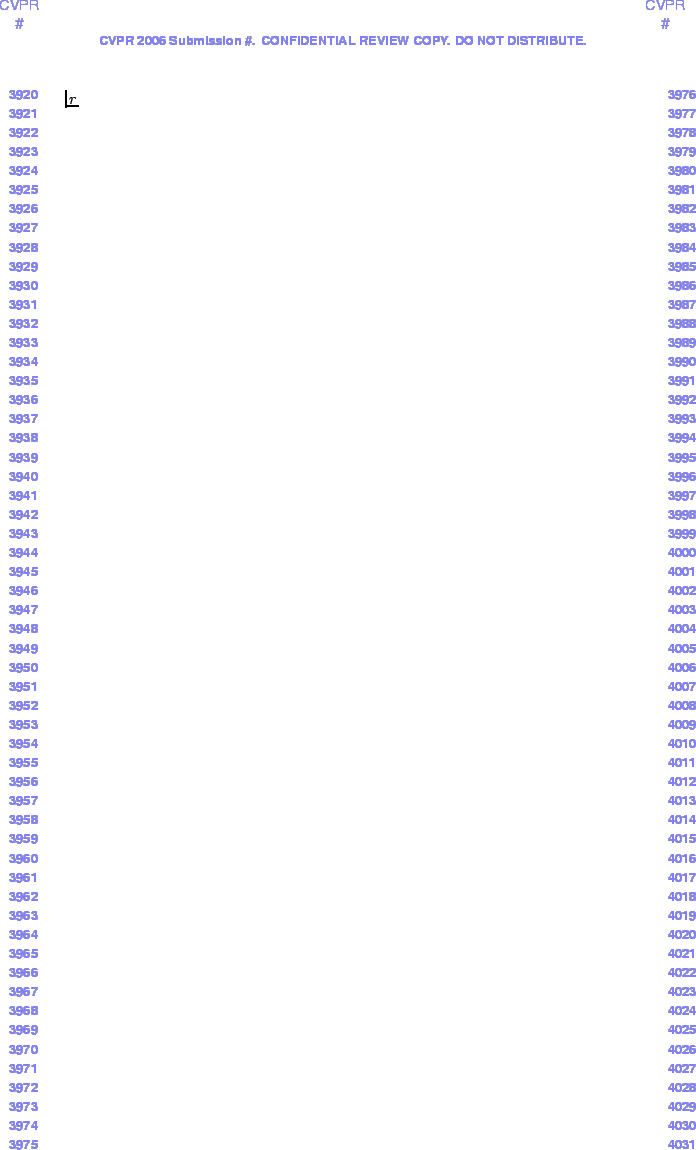 ,
which contains all pixels within a distance of the central
pixel.
,
which contains all pixels within a distance of the central
pixel.
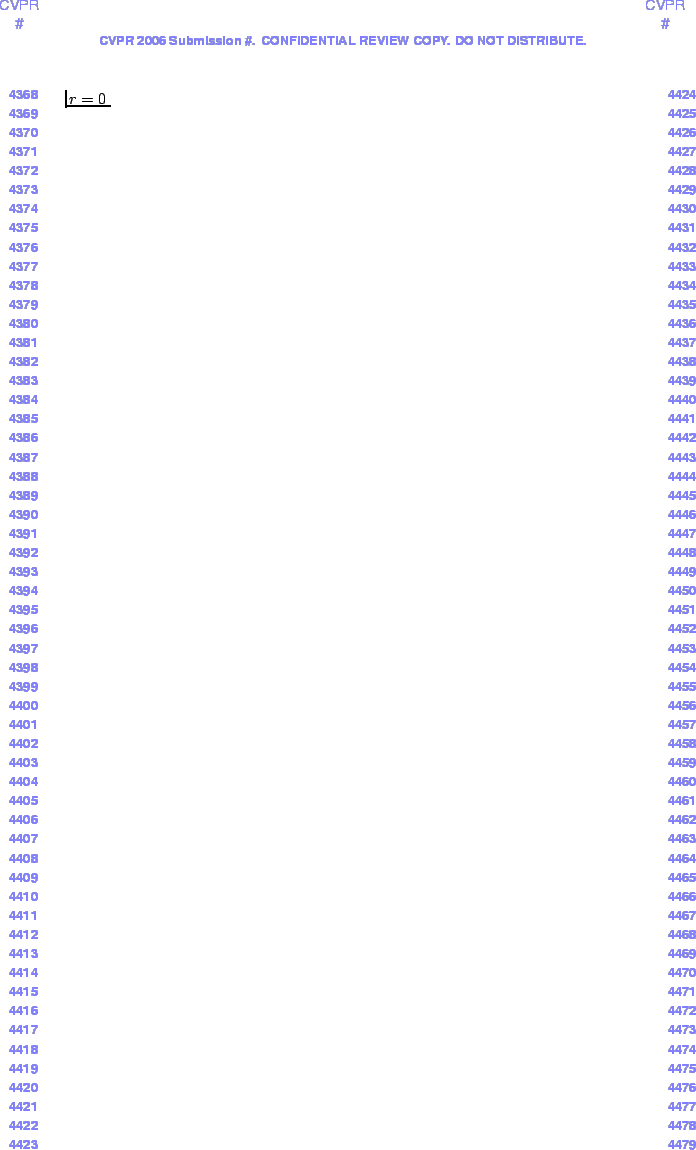
Figure 3 shows examples of shuffle distance
between an original image and a misaligned version evaluation, for
varying values of the radius . The effect of the shuffle
neighbourhood radius on the sensitivity to misalignment is obvious
as the contribution to distance perceivably decreases in areas of
limited misalignment, as we go from 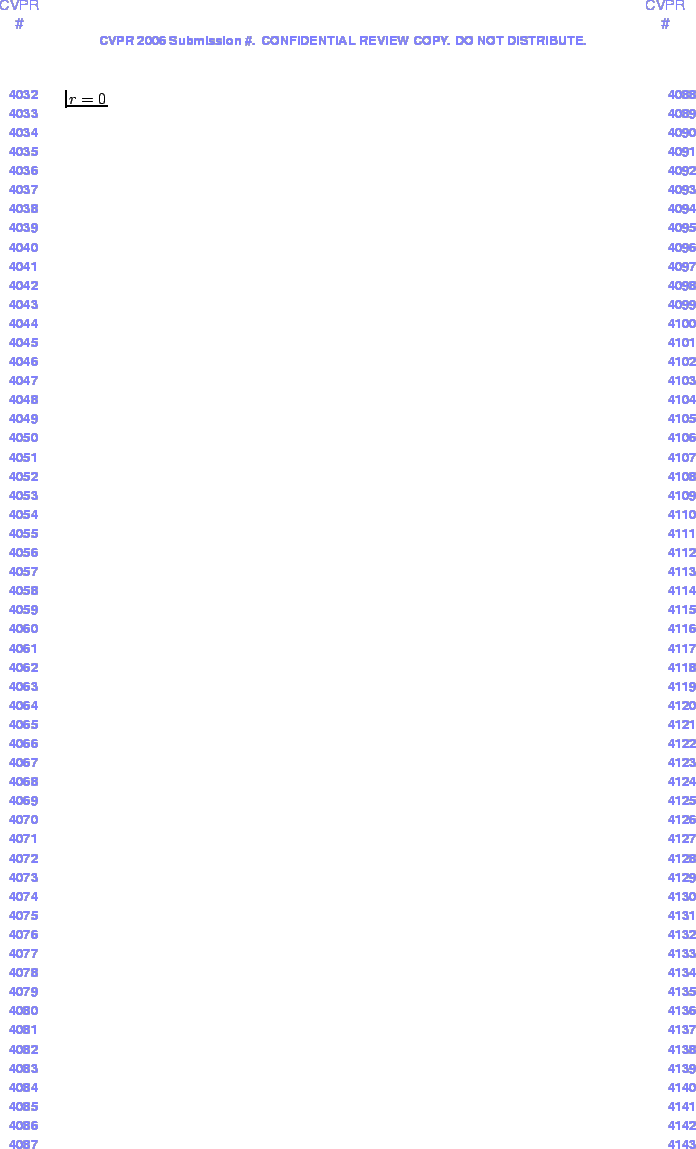 to
to 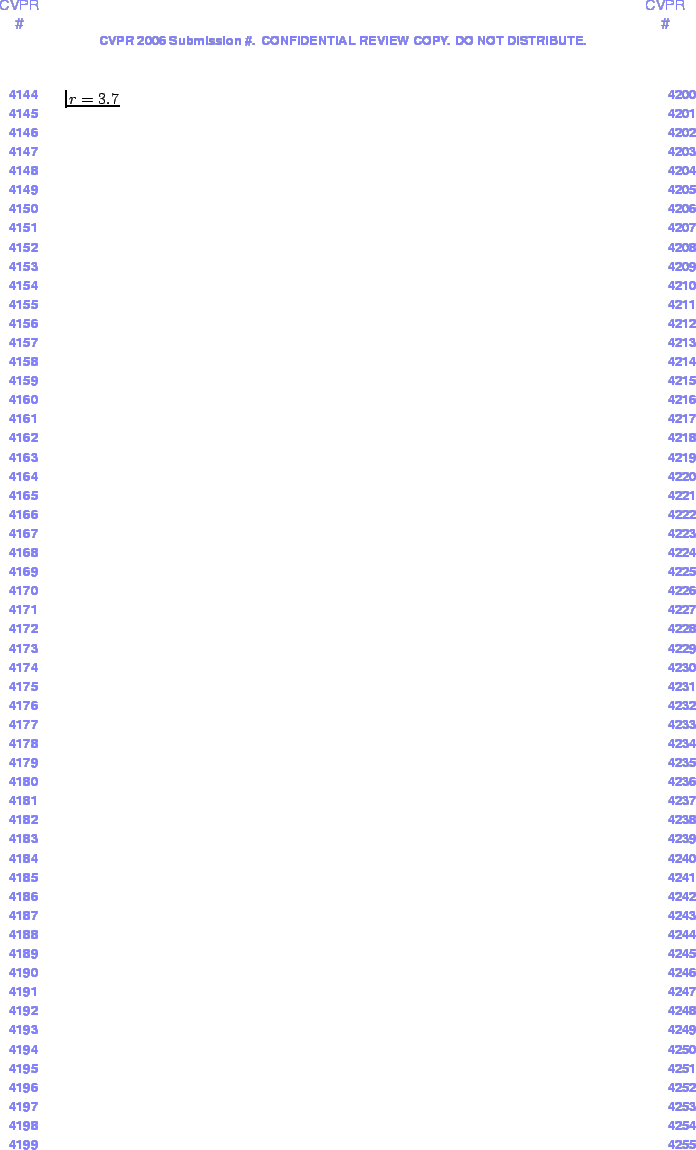 (roughly
equivalent to a
(roughly
equivalent to a 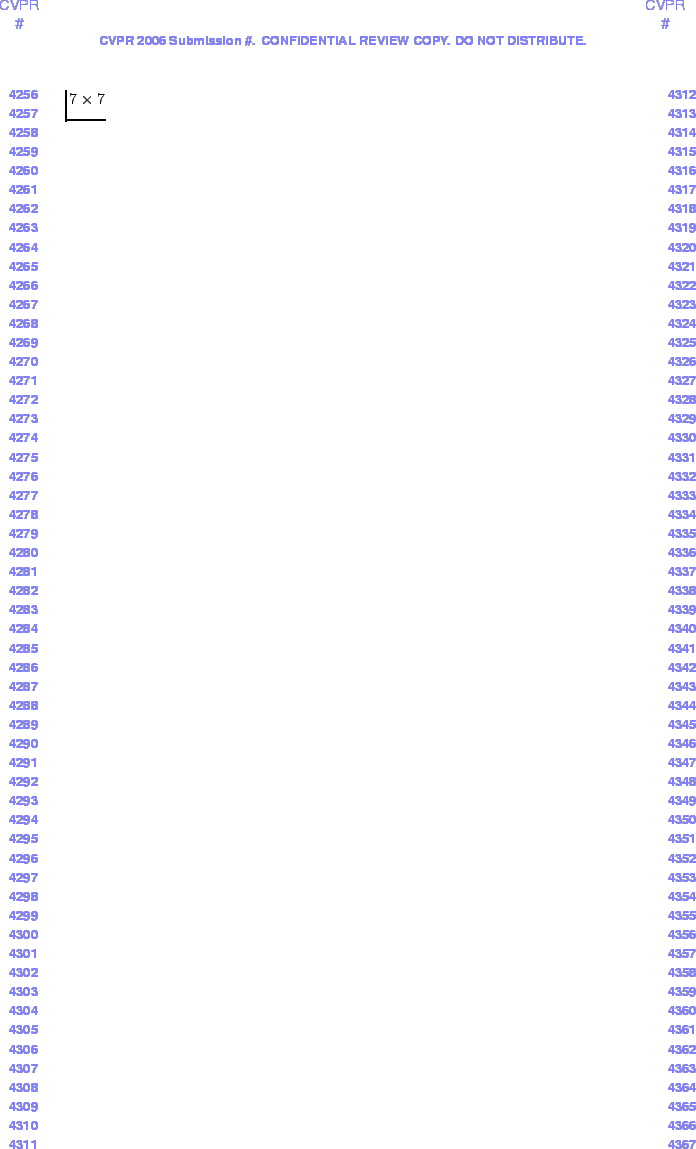 square window).
Next: Experimental Evaluation
Up: Appearance Model Evaluation
Previous: Specificity
Roy Schestowitz
2005-11-17
 PDF version of this document
 (abs. diff.)
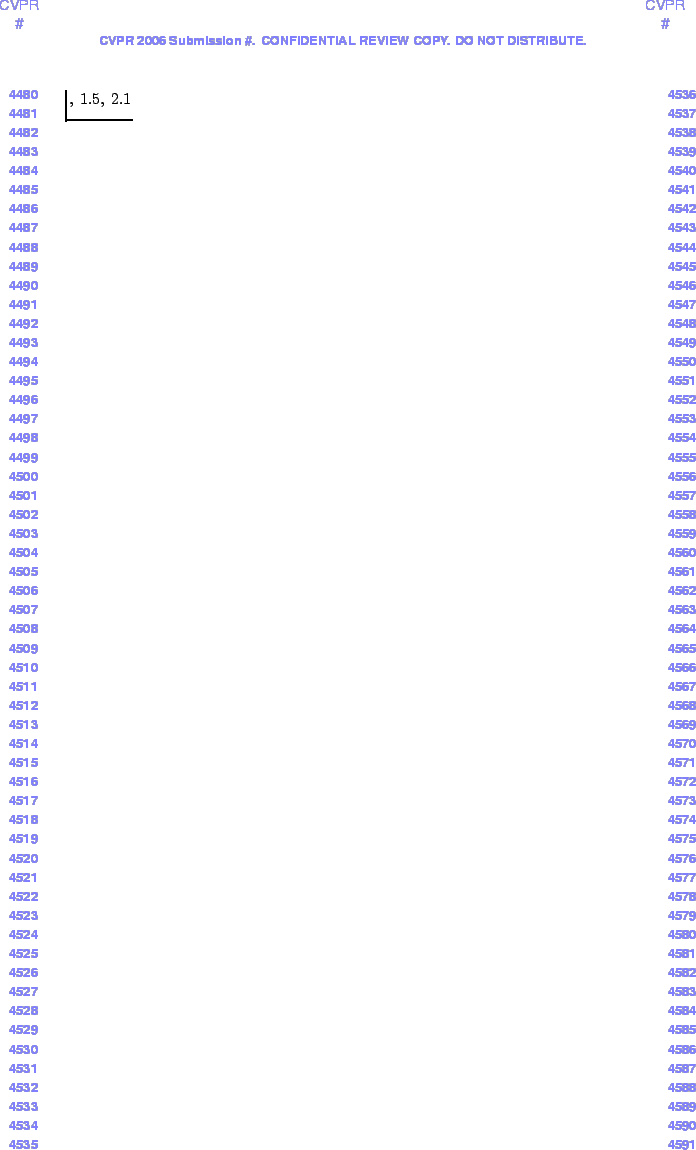 &
&  respectively.