 PDF version of this document


MIAS-IRC:
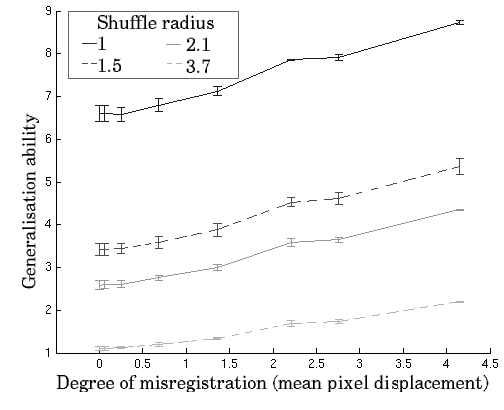
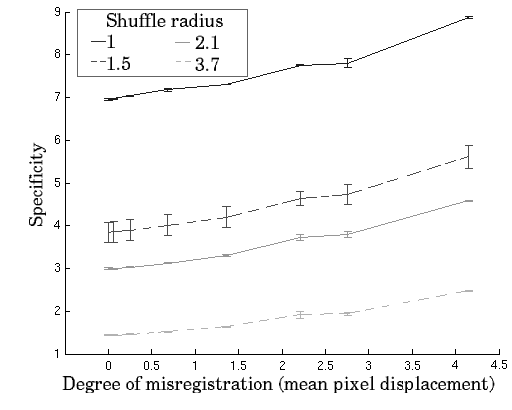
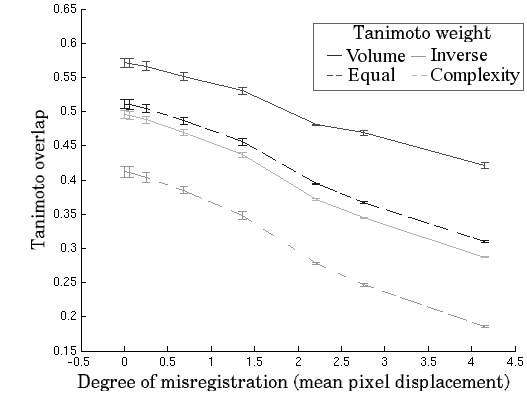
Overall, the above approach was applied 10 times using 10 different perturbation seeds to ensure that both methods are consistent and results unbiased. Results of the proposed measures for increasing registration perturbation are shown in Figure 1. Note that Generalisation and Specificity plotted for different shuffle neighbourhood radius are in error form, i.e. they increase with decreasing performance. All metrics are generally well-behaved and show a monotonic decrease in registration performance. Such results directly validate the model-based metrics, which are shown be in agreement with the ground truth embodied in the region overlap based measure.
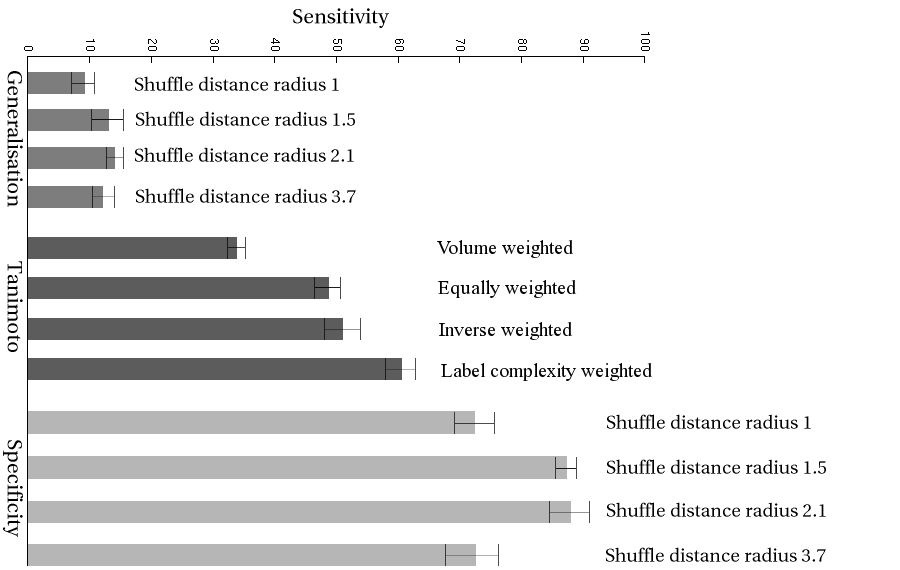
Finally, in order to obtain a quantitative comparison of the proposed algorithms we explore sensitivity of the proposed metrics, where the slighter the difference which can be detected reliably, the more sensitive the method. Sensitivity is in this case defined as the rate of change in the measure for a given perturbation range, normalised by the average uncertainty in the measurement over that range. More formally, sensitivity can be defined thus:
where ![]() is the quality measured for a given value of displacement,
is the quality measured for a given value of displacement,
![]() is the measured quality at registration,
is the measured quality at registration, ![]() is the degree
of deformation and
is the degree
of deformation and
![]() is the mean over the error
bars. Sensitivity is evaluated for all three of the proposed metrics
and shown in Figure 2 with errors bars based on both an inter-instantiation
error and a measure-specific error. The Specificity measure is the
most sensitive for any radius of the shuffle distance followed by
the overlap metric and Generalisation, with shuffle radii of 1.5 and
2.1 (equivalent to 3x3 and 5x5 neighbourhoods) giving optimal sensitivity.
is the mean over the error
bars. Sensitivity is evaluated for all three of the proposed metrics
and shown in Figure 2 with errors bars based on both an inter-instantiation
error and a measure-specific error. The Specificity measure is the
most sensitive for any radius of the shuffle distance followed by
the overlap metric and Generalisation, with shuffle radii of 1.5 and
2.1 (equivalent to 3x3 and 5x5 neighbourhoods) giving optimal sensitivity.
MICCAI:
The results of the experiment to test the effect of increasing mis-registration
are shown in Fig. 6. These demonstrate that, for all sizes of shuffle
neighbourhood, the specificity and generalisation values increase
(get worse) with increasing mis-registration![[*]](/IMG/latex/footnote.png) . The results for different sizes of shuffle neighbourhood demonstrate
that the range of mis-registration over which distinct values of specificity
and generalisation are obtained increases as the neighbourhood size
increases.
. The results for different sizes of shuffle neighbourhood demonstrate
that the range of mis-registration over which distinct values of specificity
and generalisation are obtained increases as the neighbourhood size
increases.
The results of the comparison between three different methods of NRR are shown in Fig. 9. These show that, particularly in terms of specificity, we can distinguish between the three approaches, with the fully groupwise method performing best, as anticipated. A model built using this approach is shown in Fig. 8.