 PDF version of this entire document
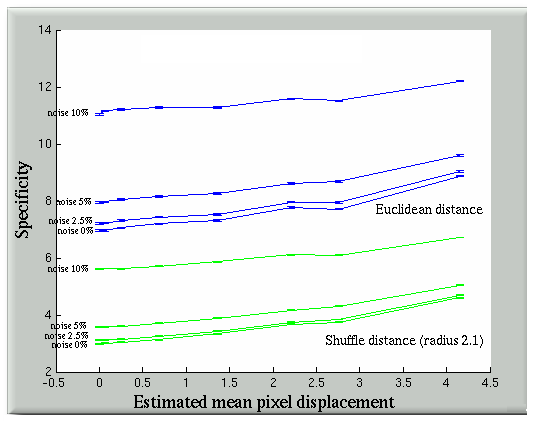
Figure ![[*]](/IMG/latex/crossref.png) shows the results of applying sensitivity analysis to the validation study. These demonstrate that Specificity is more sensitive (i.e. is able to detect smaller misregistrations) than the overlap-based approach, which is in turn more sensitive than Generalisation. Note from the error bars that these differences are statistically significant. Maximum sensitivity is achieved with a shuffle radius of
shows the results of applying sensitivity analysis to the validation study. These demonstrate that Specificity is more sensitive (i.e. is able to detect smaller misregistrations) than the overlap-based approach, which is in turn more sensitive than Generalisation. Note from the error bars that these differences are statistically significant. Maximum sensitivity is achieved with a shuffle radius of ![]() or
or ![]() . Figure also suggests that the most sensitive generalised overlap measure is obtained using label-complexity weighting. The choice of the Tanimoto Coefficient is consistent through all the experiments and each fuzzy overlap measure is based on it. The Tanimoto Coefficient is monotonically related to the popular Dice Similarity Coefficient (DSC), which would therefore produce similar results.
. Figure also suggests that the most sensitive generalised overlap measure is obtained using label-complexity weighting. The choice of the Tanimoto Coefficient is consistent through all the experiments and each fuzzy overlap measure is based on it. The Tanimoto Coefficient is monotonically related to the popular Dice Similarity Coefficient (DSC), which would therefore produce similar results.
|
Roy Schestowitz 2010-04-05


