PDF version of this entire document
As well as being consistent with ground truth, a good measure of
registration quality should also exhibit good sensitivity
(measurement accuracy). That is, it should enable us to detect
small misregistrations. By evaluating sensitivity we can also
assess the effect of varying the parameters of the two approaches
that we investigated: the shuffle neighbourhood radius ![]() for the
model-based measures and the alternative label weighting options
for the generalised Tanimoto overlap.
for the
model-based measures and the alternative label weighting options
for the generalised Tanimoto overlap.
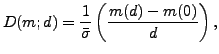
The size of perturbation that can be detected in the validation experiments will depend both on the change in the values of the measures as a function of misregistration and the mean error on those values. To quantify this, we define the sensitivity of a measure as follows.
where ![]() is the value of the measure for
some degree of deformation
is the value of the measure for
some degree of deformation ![]() ,
,
![]() is the mean error in
the estimate of
is the mean error in
the estimate of ![]() over the range.
over the range.
![]() is the change in
is the change in ![]() required for
required for ![]() to change by one noise standard error, which
indicates the lower limit of change in misregistration
to change by one noise standard error, which
indicates the lower limit of change in misregistration
![]() which can be detected by the measure.
which can be detected by the measure.
|
|
|
[Generalisation]
[Specificity] |
We computed the sensitivity for the data shown in
Figures 9, 10(a),
& 10(b). The averaged sensitivity
over the range of deformations is plotted in
Figure 11 for the various
measures.
The uncertainties on the measurements of sensitivity can also be derived
and are shown as error bars on Figure 11.
In particular, there are two separate sources of uncertainty: i) errors
associated with the finite number of deformation instantiations and ii) errors
associated with the finite number of synthetic images used in the evaluation
of the figure of merit for NRR. Considering (12), we can
evaluate the standard errors in measured quantity ![]() (for a given
(for a given ![]() ) and
) and
![]() ,
, ![]() and
and
![]() , analogously to (8) and
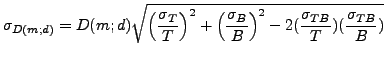
(10). Using error propagation the uncertainty on the
numerator (T) in (12) is the sum of standard errors on the two
measurements,
, analogously to (8) and
(10). Using error propagation the uncertainty on the
numerator (T) in (12) is the sum of standard errors on the two
measurements,
![]() , while the
uncertainty on the denominator (B) is simply
, while the
uncertainty on the denominator (B) is simply
![]() . Using error propagation for a
ratio of variables the uncertainty on the sensitivity becomes:
. Using error propagation for a
ratio of variables the uncertainty on the sensitivity becomes:
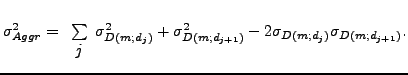
Finally, when sensitivity is aggregated across the deformation range, total uncertainty on the sensitivity, using the addition error propagation rule again becomes: