 eople who say that nothing can replace Photoshop and nothing can replace Microsoft Office simply forget that the functionality they must be implicily referring to is hardly used by anyone among the entire userbase. As pointed out in the previous post, two months with QtOctave and other free/libre software taught me that there is no reason to deny that ~90% of MATLAB’s users can abandon it and use free/libre software instead, maybe more happily in fact (stability, program weight, and cross-platform with access to the source code count, it’s not just a matter of cost). I have used some of the most advanced functionality in MATLAB, so I do know what I am talking about here.
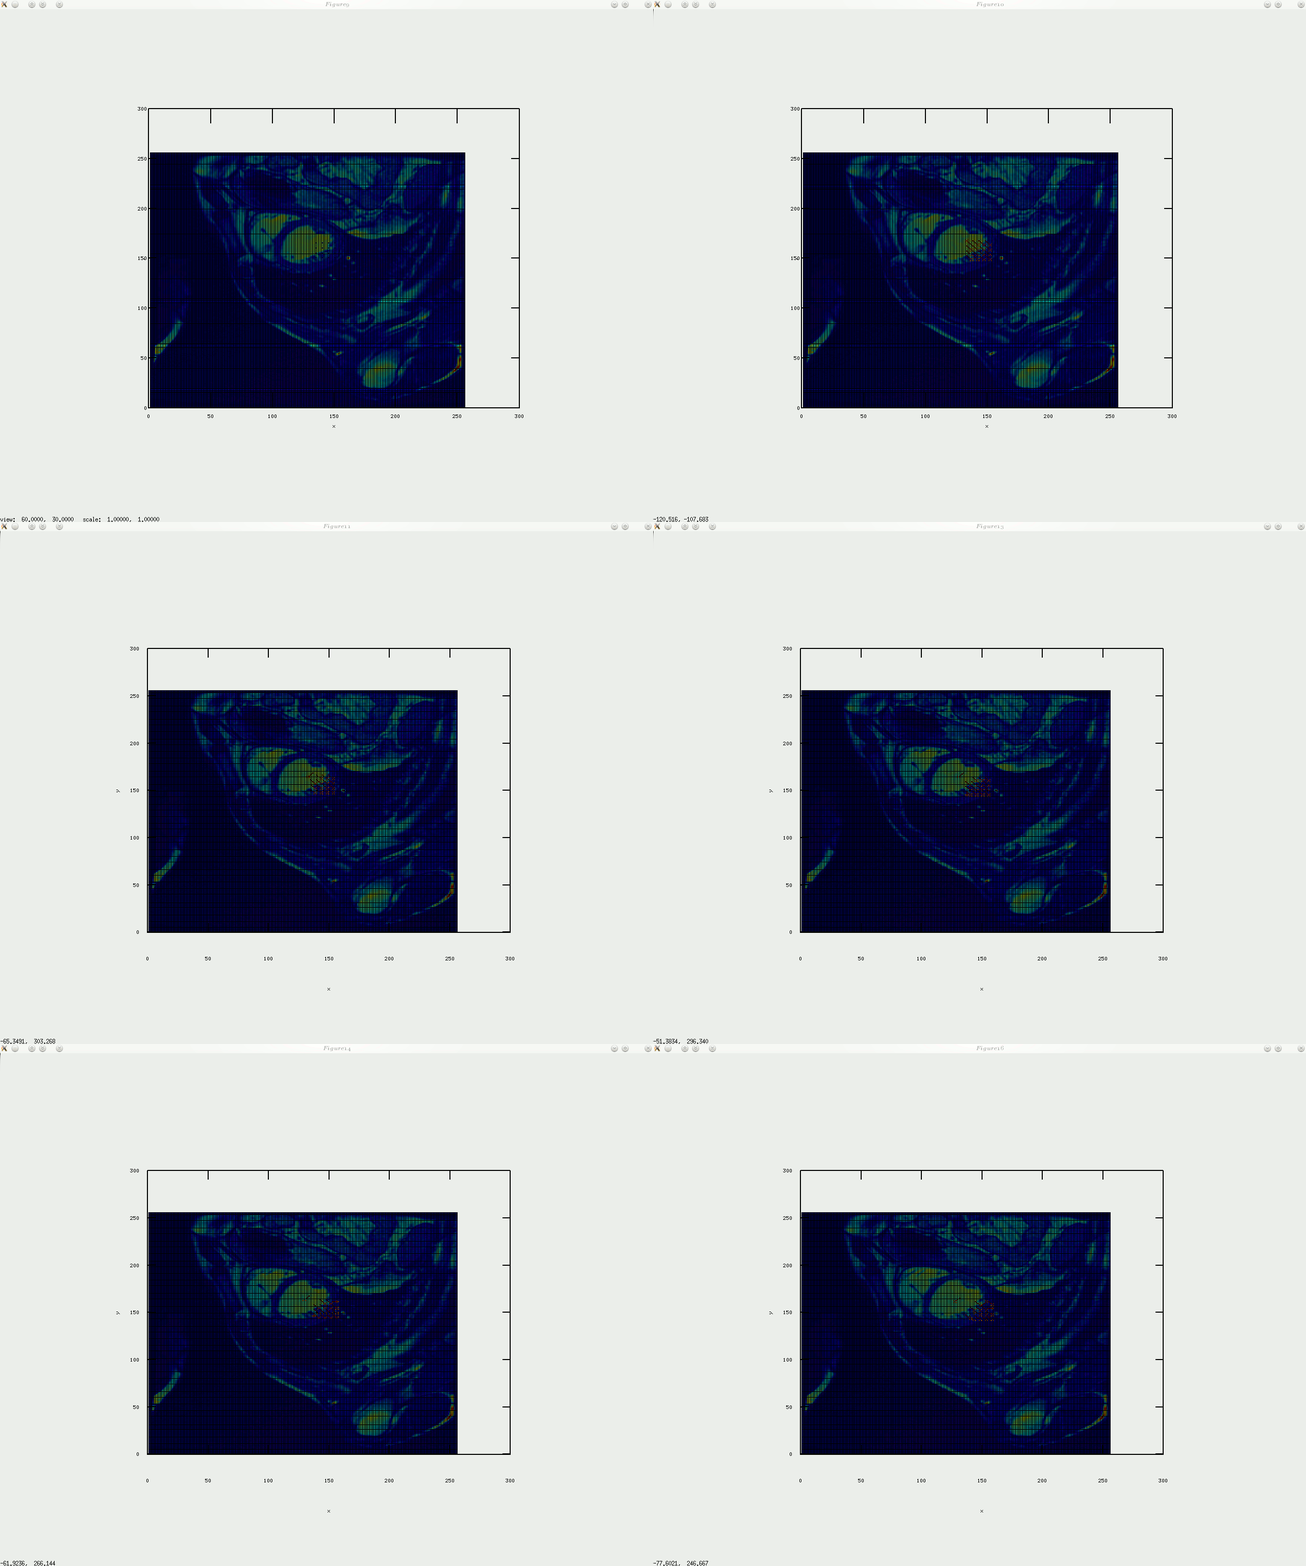
Today I present free/libre software called QtOctave, which is a graphical front end to Octave and it uses Qt, as the name suggests. Qt is cross platform, so as expected it runs on Windows too. Without further ado, let’s take an overview of what QtOctave looks like. I typically put QtOctave on my eighth workspace in KDE, which helps me remember where to find it. Here is my workspace 8 (screenshot, click to magnify).

This picture may be daunting, but QtOctave does a good job hiding lot of the functionality under menus, which reduces clutter. QtOctave uses Octave (CLI) as its engine, but it provides a friendlier face to it. Let’s break down this picture and explain what each component does, in turn.
Menu
The main menu contains many of the basic functions one ought to expect. By “functions” what I mean is either functionality like opening files or mathematical functions that are commonly used. Many options there control the appearance of the GUI, whose core component of the command line containing the core, Octave. QtOctave wraps it up nicely and provides tools to work with/around it.

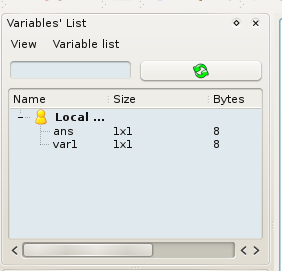
Variables
Octave exposes names and corresponding values of variables it holds, but only upon demand. How about having a GUI component to keep track of these and display this information all the time. You want it? You got it:
Commands and Dynamic Help
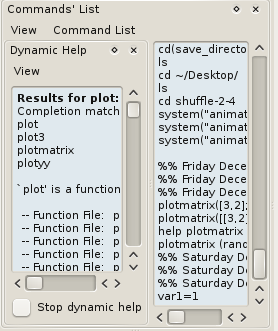
The command pane is a companion tool which helps keep track of recently-used commands and makes these conveniently available. In my case, I added the “Dynamic Help” component, to help show what commands are available as soon as I start typing. The contents in the example below show what appears in the window as soon as I began typing “plot”. The namespace of commands can be highly populated if many modules are used (in session’s path), so this is a good way to keep track without looking elsewhere. Bash has a similar functionality which it makes available via the “Tab” key.
Directories
Directories and files are sometimes easier to approach and navigate though when they are quickly accessible through the main GUI. This has use in all sorts of circumstances as drag-and-drop functionality is broadly supported.

Terminal
In the main body of the program there is the terminal section (or other components, if one chooses to make them available there). Show below is an example of basic interaction with Octave.

CLI
The command-line interface is an integral part of the above and it supports up/down arrow key for use of commands history.

Editor Menu
This editor can be made part of the main windows, but it does not have to be. I personally choose to make it an external window on a second monitor where it offers a lot of viewing space. The menu has all one ought to expect to find in a standard text editor, but it also contains program-specific buttons like execution and debugging.

Code
Here is a simple code example. The fonts that I use do not look good because I favour monospace, which helps indentation and other tasks where each character is treated as equal.

Breakpoint
Here is another example of code (further down from the top). This helps show how breakpoints are represented in the editor. Together with the variables panel this provides an excellent environment for debugging, so the editor is definitely not detached from the core components; It’s custom-made for it.

More Components
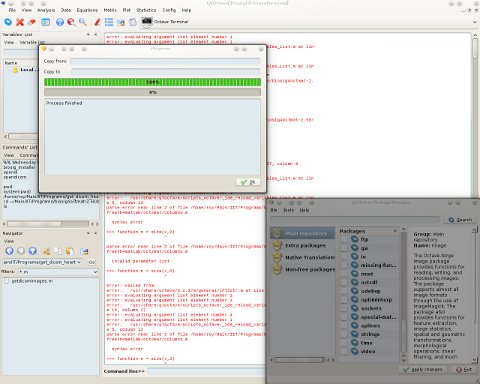
There is a lot more under the menus, e.g. package management (see the image below). But that’s a subject for another day.
If you like what you see in QtOctave, then consider giving Octave a look. Both Octave and QtOctave are in the *Ubuntu and Fedora repositories, so they only take a moment to install.
 ITHOUT preparing any notes I’ve embarked on the task of making this first Octave tutorial, which hopefully helps show how to install it on a Debian- or Red Hat-based system.


 Filed under:
  ACK in October I planned to create some videos that explain to people how to use Free (as in libre) software in scientific computing and also how to program with the corresponding syntax. The following unscripted video is an opening demo of what I hope will improve as I gain experience with screencasting. It’s down to figuring out the audio, the window size, and all sorts of intuition-related skills which will be acquired over time.
 eople who say that nothing can replace Photoshop and nothing can replace Microsoft Office simply forget that the functionality they must be implicily referring to is hardly used by anyone among the entire userbase. As pointed out in the


 ver the past couple of months I have been assessing the combination of Octave with some other free/libre software such as Scilab and QtOctave. I did this as part of my existing job in research, as my blog posts ought to have revealed on occasions. I’ve been using MATLAB for the best part of a decade and was at one time ranked #1 in the world for my contributions to MATLAB Central. That, however, changed several years ago when I came to grips with the fact that my free/libre code for MATLAB only helped promote the underlying stack which included MATLAB, a nasty piece of highly expensive proprietary software with BSA bullies behind it. MathWorks is exploiting free labour of many people to sell its non-free software. I can vividly recall Slashdot comments stressing this point, which profoundly changed my attitude towards MATLAB. So I turned to Octave, as I did half a decade ago, but this time it was a lot more mature. People recommended to me programs other than Octave, too. I checked these under different distributions of GNU/Linux and even Windows, which many people out there continue to use, especially on their desktop. I helped some people dump MATLAB. I saw how easy it was.
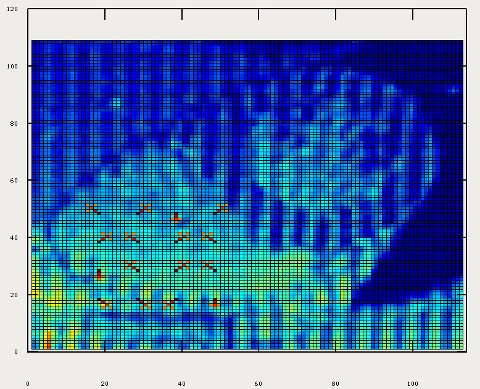
 oday I implemented circular arrangement of landmark points for the algorithm to identify something approximate/similar to the shape of the heart and then place a given number of points around there. In addition, a boundary is shown by sampling between those points, which gives a contour, with or without arrows on top of it. I will upload the code shortly (needs tidying up).
 ather than use the
