 ORKING with bare metal for the purpose of maximal hardware utilisation and performance is not the same as working with typical computer programs. Developing software for research is also different from software development for end users, where the software is treated as a product. Different scenarios require different methodologies and different levels of polish, and thus have different specifications and priorities. In research, brute force becomes essential to the success of one group or another.
I often find myself working on servers or clusters (only GNU/Linux), in which case it is useful to manage up to 50 computers, for example, remotely, at the same time. With full GUI sessions it can be a disorienting task, but that too can be achieved and I wrote about it roughly 6 years ago in this blog (back when I was a Ph.D. student).
Working from the command line at a desktop is perfectly acceptable if brains and not candy count, so platforms like Mac OS X are irrelevant. To do coding on the server I currently use vi as the editor in one terminal and the MATLAB session in another. On the desktop I would use QtOctave, as covered before (also in some screencasts). Unfortunate issues that had me revisit MATLAB (which in any case would be inevitable as means of ensuring compatibility with colleagues) led me back to the old days of developing over SSH (using KIO slaves and the likes of that). Quick access to the file can be gained using abbreviated wrappers such as:
./Main/Programs/Scripts/SSH/42
/opt/matlab/bin/matlab -nodesktop -nosplash -r "addpath(genpath('/home/S00/schestr0/'))"
where 42 is a script numbered after the machine number and the latter command initialises the command line. /home/S00/schestr0/ is using NFS and it can be reached from any computer at the department at the same time (multiple machines can write to the filesystem at the same time, too). If the files are edited locally, they can be passed across to the server using a simple command that transfers them in encrypted form.
scp /home/roy/Main/IT/Programs/get_dicom_heart/* -r
schestr0@eng041.cs.man.ac.uk:/home/S00/schestr0/get_dicom_heart/
Occasional local backups (usually nightly because it is resources-intensive over USB2) are achieved as follows:
mkdir /media/disk/Home/`date +%Y-%m-%d`

tar -cf - /home/roy|split -b 1000m - /media/disk/Home/`date +%Y-%m-%d`/Home-`date +%Y-%m-%d`.tar.
To decipher this, try:
man tar
man split
For example in:
tar -cf - /media/SEA_DISK/Home/|split -b 1000m - Baine-`date +%Y-%m-%d`
the backup is split into chunks of 1 gigabyte and the files are named by the date
To reassemble the above (resorting from backups):
cat *|tar -xf -
No command line interface should be intimidating. Many powerful computer tasks are managed from it because the command line makes streamlining simpler and scripting jobs is a lot easier. My programs are written in a way that enables assigning many parameters like paths and wildcards, which lets the programs run for many hours and automatically produce output like images, videos, and text for inspection later. Research in computer vision or computer graphics requires heavy computation and for compelling experiments, the larger the sample sets, the more convincing the results. Use of computer resources therefore becomes the difference between failure and success and those who fail to master it can easily perish against the competition. Another valuable skill is knowing how to reuse code (legally of course) and this is where free/libre software orientation helps a lot. Publication in Open Access (OA) and availability of one’s own work — including code — can help gain more citations, which is the currency by which many publications are being judged.
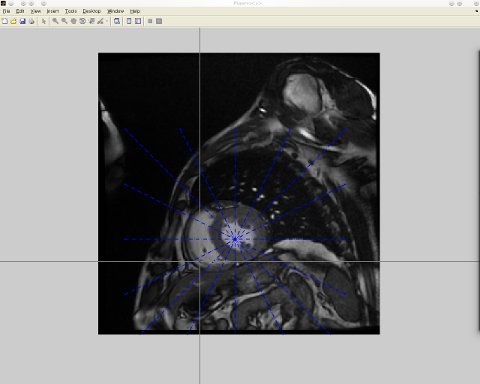
 ccasionally, in numerical programming, one may wish to plot or instantiate a grid of a circular (or spiral) nature. Here are some code samples for those trying to achieve it. The following sets some values of interest:


 Filed under:
  his Octave ramble is an experimental video where I try to present some elements of the program before preparing something more professionally put. In this part of a series I go just through some elements of QtOctave and show how it is used in practice. In the future I will prepare something much more polished that is planned in advance.
 ORKING with bare metal for the purpose of maximal hardware utilisation and performance is not the same as working with typical computer programs. Developing software for research is also different from software development for end users, where the software is treated as a product. Different scenarios require different methodologies and different levels of polish, and thus have different specifications and priorities. In research, brute force becomes essential to the success of one group or another.
 ESTERDAY I encountered my first major setback in Octave for Kubuntu. It was a bug, not a missing feature. It involved an outside library again. I tried installing a newer version of gnuplot (installing the latest one by compiling the source code), but this did not resolve the issue. All in all, over an hour was spent on it, first assuming that I was coding wrongly and later realising that


 or the sake of cross-application/framework compatibility, one occasionally needs to alter code until it works everywhere, without the need to keep two (or more) separate codebases. This situation is far from ideal, but then again, not everything works like Java. When colleagues use a different platform and occasionally prefer proprietary software it is only fair to do some extra work catering for it.