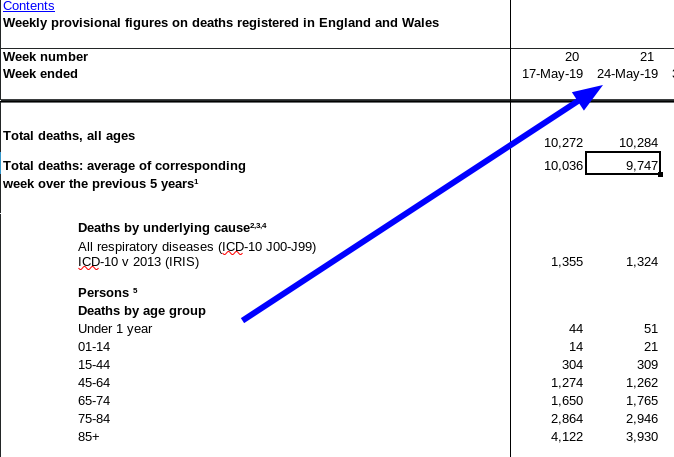
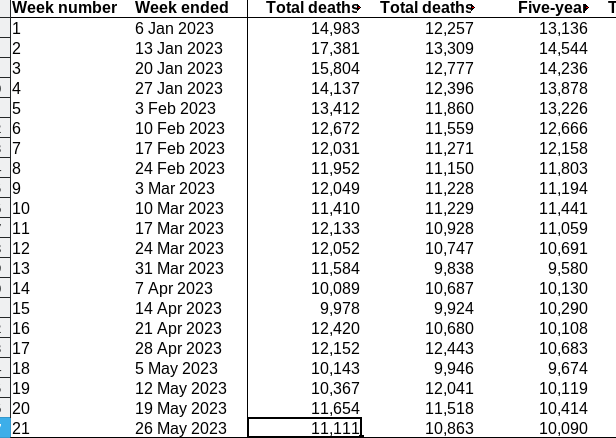
In 2015-2019 (Average) 9,747 People Died in England and Wales in Week 21. That Grew to 11,111 This Year. It’s a 14% Increase!
 Filed under:
 New data released by ONS this morning.
Let’s compare pre-pandemic years:
To this year:
14% higher than before the pandemic.


|
|


Navigation |
New data released by ONS this morning.
Let’s compare pre-pandemic years:
To this year:
14% higher than before the pandemic.
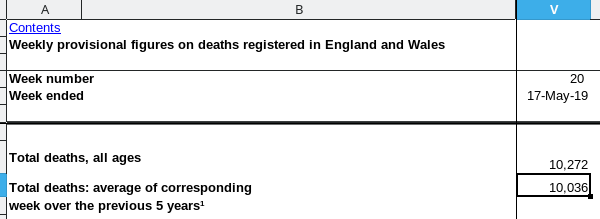
Week 20 2022-2023 deaths:
Week 20 2019 (and past 5 years) deaths:
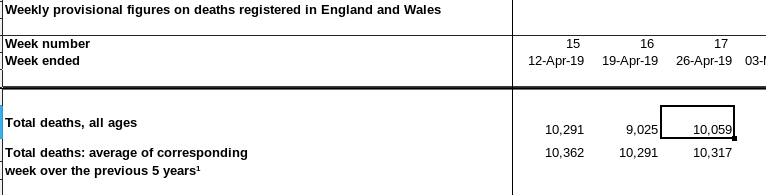
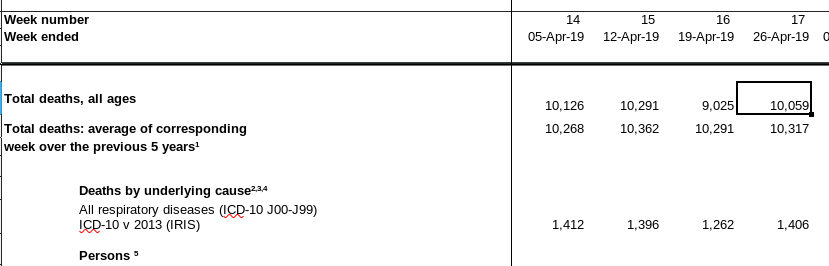
 ‘VE just taken a snapshot of the figures posted about an hour ago, showing that from 10059 deaths in week 17 of 2019 (before COVID-19 broke out) we rose to 12152, or an increase of 2093 deaths for the week. That’s an increase of 21%. Health emergency, right? Just don’t ask our government for comment… they’d rather not discuss this or investigate the cause/s.
Description, in case Google takes down his videos again:
Excess deaths, dramatic increase, week ending 21 April 2023
www.ons.gov.uk/peoplepopulationandcommunity/births…
The number of deaths registered in the UK in the week ending 21 April 2023
(Week 16)
Was 14,024
22.1% above the five-year average
2,540 excess deaths,
of these deaths, 615 involved COVID-19
England and Wales
Week 16, 12,420 deaths were registered in England and Wales
538 of these deaths mentioned novel coronavirus (4.3% of all deaths)
Of the 538 deaths involving COVID-19, 66.5% (358 deaths) had this recorded as the underlying cause of death
The number of deaths was above the five-year average
Private homes (29.0% above, 771 excess deaths)
Hospitals (20.2% above, 924 excess deaths)
Care homes (25.3% above, 525 excess deaths)
Other settings (11.7% above, 92 excess deaths)
Could Bradford Hill criteria help?
The larger the association, the more likely that it is causal.
Consistent findings observed by different persons in different places
Lack of alternative explanations
The effect has to occur after the cause
Greater exposure should generally lead to greater incidence of the effect.
A plausible mechanism between cause and effect is helpful
Coherence between epidemiological and laboratory findings increases the likelihood of an effect.
Occasionally it is possible to appeal to experimental evidence
Analogies or similarities between the observed association and any other associations.
Sometimes, reversibility
CHECKED about 1.5 hours ago to see if the 10 May 2023 ONS numbers were already online. They were indeed, maybe around 9:30AM.

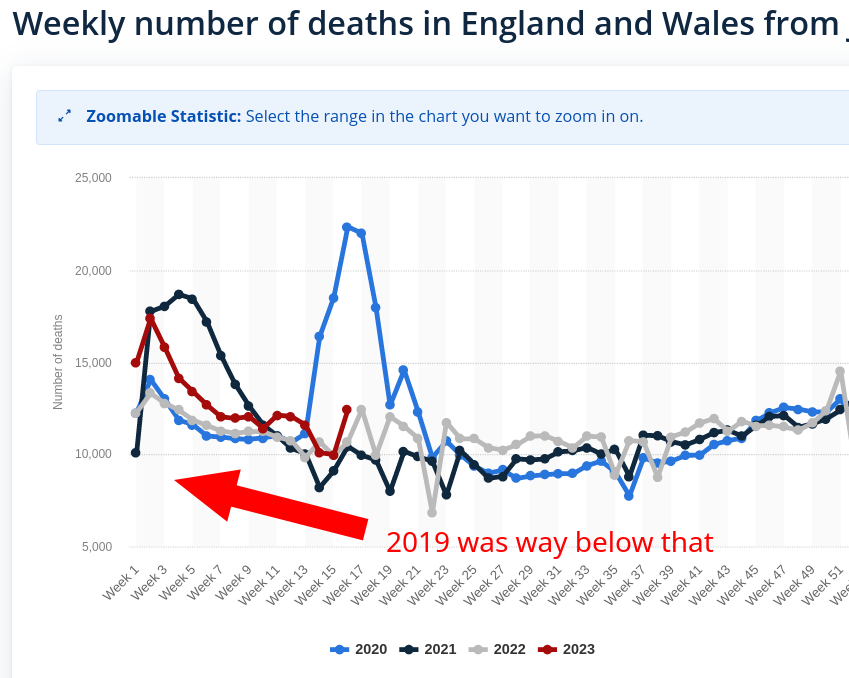
What does the latest data tell us? Compare 2019 deaths count:
Now watch this year:
Focus on week 17, the latest on record. From 10,059 deaths in 2019 it rose to about 12.2k in the same week of this year, yet WHO tells us pandemic stuff matters no more and it’s time to get back to “normal”. Don’t listen to WHO. Rely on data, not bureaucrats and politicians who masquerade as health experts.
We’re worse off even by lockdown standards (2020)

T is exceedingly frustrating to be governed by institutions or ‘public’ organisations funded by pharmaceutical companies (patent licensors) and their shareholders. The conflict of interest is profoundly yet rarely mentioned.
Based on the hard data, or the after-the-fact analysis, COVID-19 has left society far less healthy. In the UK and Ireland, for instance, far more people than one might expect are dying each day. The media doesn’t talk about it (or barely/seldom mentions it), but many critical thinkers have openly expressed concerns about these figures. The causes barely included suicides (they’re less than 5% of these gains); so what is it?
That WHO has become a bit of a COVID minimiser (not denier), helping to shape the narrative for companies whose products barely helped, says a lot about WHO and the UN. Don’t take health advice from these bureaucrats.
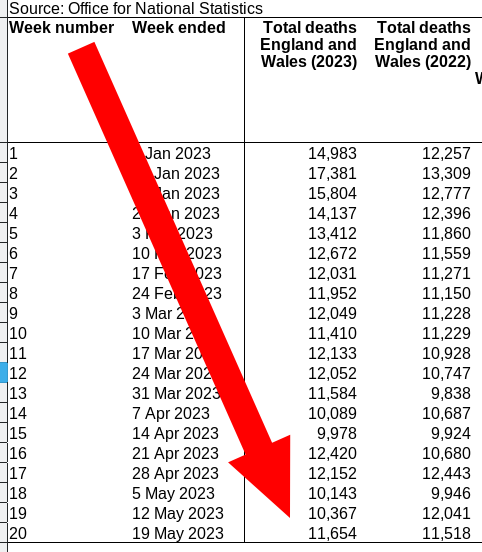
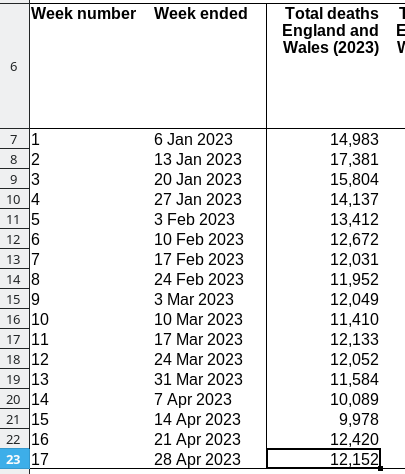
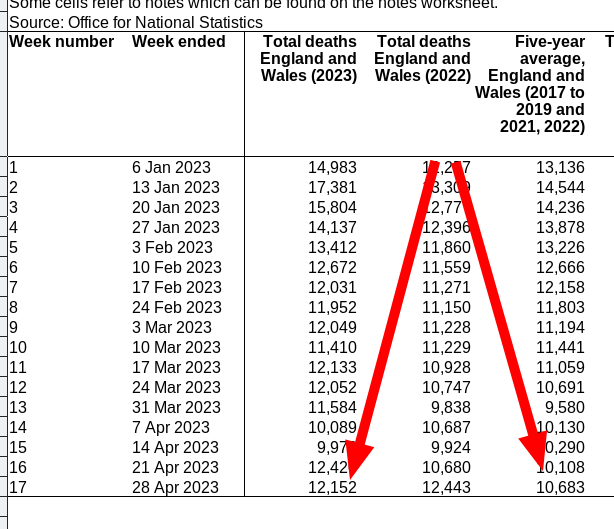
England and Wales death totals by week:
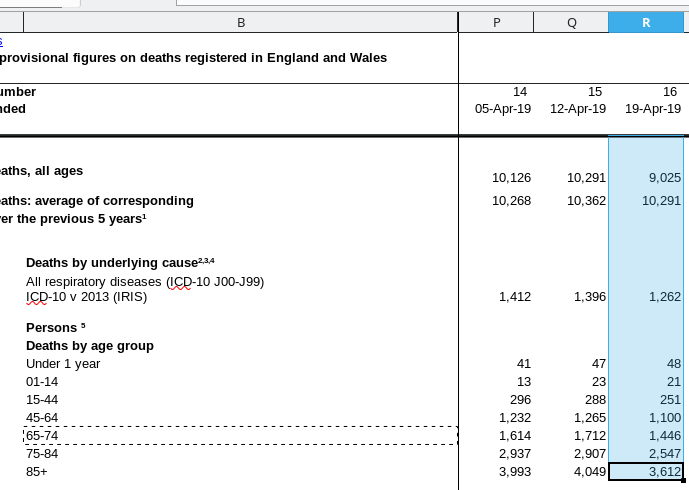
 urther to what I published on Wednesday, here’s a breakdown of increase in deaths by age group, debunking the notion that it is impacting only very old people.
The number on the left is the total deaths for week 16 (latest on record) in 2019, compared to the same week in 2023 (shown on the right below), i.e. last month:
For ages 15-45, 321 compared to 251: 28% increase in fatalities
For ages 45-64, 1478 compared to 1100: 34.4% increase in fatalities
For ages 65-74, 1878 compared to 1446: 30% increase in fatalities
Seems like a national health crisis, but the media hardly talks about it, so let’s pretend it’s not happening.
Retrieval statistics: 21 queries taking a total of 0.130 seconds • Please report low bandwidth using the feedback form
Original styles created by Ian Main (all acknowledgements) • PHP scripts and styles later modified by Roy Schestowitz • Help yourself to a GPL'd copy
|— Proudly powered by W o r d P r e s s — based on a heavily-hacked version 1.2.1 (Mingus) installation —|