Introduction About Site Map

XML
RSS 2 Feed RSS 2 Feed
Navigation

Main Page | Blog Index

Archive for the ‘Health’ Category

ONS Official Data: Deaths Rose in All Age Groups

Data for week 44 (2022): England and Wales: Deaths Up 21% Compared to Pre-COVID-19 Levels, Based on Data Released Only Moments Ago

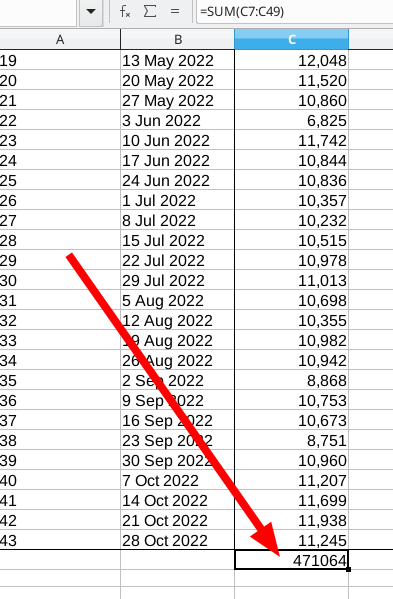
Comparing this year to 2019 (total number of deaths):

Age under 1: 47 this year, 45 in 2019
Ages 1 to 14: 16 this year, 19 in 2019
Ages 15 to 44: 333 this year, 289 in 2019 (15.2% increase)
Ages 45 to 64: 1395 this year, 1196 in 2019 (16.1% increase)
Ages 65 to 74: 1816 this year, 1663 in 2019 (9.2% increase)
Ages 75 to 84: 3448 this year, 2938 in 2019 (17.4% increase)
85 up: 4740 this year, 4014 in 2019 (18.1% increase)

Conclusion: it seems like all adults (15 or over) are affected almost equally. Deaths rose by about 15%. This isn’t based on some subsample or random sample; it’s the complete data, which us very large.

England and Wales: Deaths Up 21% Compared to Pre-COVID-19 Levels, Based on Data Released Only Moments Ago

Minutes ago ONS released these new numbers, which I’ve been eager to see for days (also refreshed the page once in several minutes), having examined closely some troubling trends since the summer. Here’s the update:

Minutes ago ONS

We’ve made a local copy as OpenDocument Format (ODF).

For comparison’s sake, here are the latest numbers:

UK week 44 in 2022

Week 44 deaths in 2019:

Week 44 deaths in 2019

11795 (this year) – 9777 (pre-COVID 5-year average) = 2018 or 20.64%.

Office for National Statistics Makes It Hard to Demonstrate Increase in Heart Failures

As per these pre-pandemic numbers, the causes of death across the UK look like this:

Disease death range of years

This should be self-explanatory. The data is here as ODF.

2022′s breakdown by causes is framed rather differently, which makes comparison difficult (maybe intentionally).

2022 cause of death

The corresponding Web page does not specify totals per cause. The hypothesis here is that there’s a correlation between the increases in heart attacks or other cardiac events. Some are fatal.

An earlier report said that “leading cause of death in England in June 2022 was dementia and Alzheimer’s disease (10.8% of all deaths); in Wales, the leading cause was ischaemic heart diseases (10.7% of all deaths).”

So there’s somewhere around 11%. This is for June:

Cause of death in June

To quote some more:

In the first six months (January to June) of 2022, the leading cause of death in England was dementia and Alzheimer’s disease (107.7 deaths per 100,000 people). In Wales, the year-to-date leading cause of death was ischaemic heart diseases (116.8 deaths per 100,000 people).

In England, the year-to-date COVID-19 mortality rate decreased to the fifth leading cause of death (46.7 deaths per 100,000 people) from the third in May 2022. This was statistically significantly lower than the top two leading causes of death (dementia and Alzheimer’s disease, and ischaemic heart diseases), and significantly lower than four of the other seven leading causes.

In Wales, deaths due to ischaemic heart diseases, and dementia and Alzheimer’s disease were also the top two leading causes of deaths. They were statistically significantly higher than any other cause of death. Deaths due to COVID-19 decreased to the sixth leading cause of death in the year-to-date (46.9 deaths per 100,000 people), from fourth in May 2022. This was significantly higher than all leading causes ranked lower.

So about 1.17 in 1,000 people died with “leading cause of death [being] ischaemic heart diseases” in the first 6 months.

The tendency to release in such inconsistent presentation forms (or presenting different kinds of data) makes one wonder if the motivation is to hide something. Why should it be so hard to figure out how many people died annually from heart failure before and during the pandemic?

An Emergent Pandemic of Sudden Deaths in the UK (People Dying at Home)

Sharp increase in sudden deaths e.g. heart failure

ONS has released this data, but it left out pertinent numbers for the past 5 years so we cannot compare pre-COVID-19 and pre-vaccination numbers to this year’s huge figures.

Remember that the 5-year average includes 3 years of pandemic and only 2 years pre-pandemic. This can be misleading, giving a false sense of progress.

Coronavirus (COVID-19) Deaths: Open Data as OpenDocument Format (ODF)

Coronavirus (COVID-19) latest insights: Deaths

It’s good that this data has been published, but the Office for National Statistics (ONS) foolishly or inadvertently (certain inadequately) favoured proprietary Microsoft formats instead of open standards. Here are the data sets in a free format:

  1. Deaths involving COVID-19 decreased in the UK
  2. The proportion of deaths involving COVID-19
  3. Mortality rates due to COVID-19
  4. Deaths by age
  5. Pre-existing health conditions
  6. And obesity as factor
  7. Excess deaths
  8. Private homes death location
  9. COVID-19 and flu deaths
  10. Evidence that average age of death is lower for COVID-19 than flu and pneumonia

ONS: More Than 1 in 50 People in England Estimated to be COVID-19 Positive This Month

And here is the graph plotted based on this new data:

% of population testing positive for COVID-19

Over 13,000 Registered Deaths in the UK Per Week in Autumn (We’re Still Losing Almost as Many People as When COVID-19 Started)

IT IS hard to find mortality rates (pre-COVID-19) for the whole of the UK. The closest thing to it is this FOIA/FOI request or this month’s data file, which shows:

UK deaths based on ONS

The number on the right is total deaths per week (2022).

Looking at the FOIA, here’s what it says: “Using the Deaths registered weekly in England and Wales, provisional, as at week 46 (13th November 2020) 529,928 registered deaths in England and Wales.”

For the year prior: “In 2019, there were 530,841 deaths registered in England and Wales.”

Screenshot below included, as the page will vanish one day:

ONS FOIA

So far, in the first 43 weeks of 2022, in England, Wales, Scotland and Northern Ireland combined there have been 536,196 deaths (I’ve put together the numbers).

We’re seeing about 13,000 deaths per week, so expect 40,000 more in the 3 weeks that follow, i.e. about 575,000 deaths.

In the above FOIA, ONS does not give the complete figures for the whole of the UK (those are hard to find, maybe by intention), but using this weekly update we get for England and Wales:

471,064. With 9 more weeks ahead (for the year to finish). 3 more weeks from now it’ll be about 502,000 compared to 529,928 at the same period in 2020.

wales-england-deaths

Extrapolate a little and find that in 2022 we’re not doing a lot better (than in 2020) in terms of preventing deaths.

Retrieval statistics: 21 queries taking a total of 0.150 seconds • Please report low bandwidth using the feedback form
Original styles created by Ian Main (all acknowledgements) • PHP scripts and styles later modified by Roy Schestowitz • Help yourself to a GPL'd copy
|— Proudly powered by W o r d P r e s s — based on a heavily-hacked version 1.2.1 (Mingus) installation —|