Introduction About Site Map

XML
RSS 2 Feed RSS 2 Feed
Navigation

Main Page | Blog Index

Archive for the ‘Programming’ Category

Cardiomat Version 1.0 is Released

TODAY I AM releasing the final code from my current project. The following is the accompanying README file:


Homepage: http://schestowitz.com/Research/Cardiac/Cardiomat
Index of related documents: http://schestowitz.com/Research/Progress/2010-2011.htm

INTRODUCTION

Cardiomat is the name given to an Octave/MATLAB program whose intended use is heart tracking, with various different bits that help probe cardiac structure and perform basic measurements.

FILES

Contained in the package are the following M-files and sub-directories:

./Experiments
./Experiments/fiesta_simulation-old-experiments.m
./create_synthetic_set.m
./GUI
./GUI/cardiomat.png
./GUI/splash.m
./GUI/splash.fig
./GUI/get_parameters_from_user.m
./GUI/getoptionsgui.m
./GUI/cardiomat-title.jpg
./GUI/cardiomat.m
./GUI/cardiomat.jpg
./getdicomimages.m
./loadtaggedsequence.m
./README (this file)
./Imported
./Imported/findit
./Imported/findit/findit.m
./Imported/arrow
./Imported/arrow/arrow.m
./Imported/gradient
./Imported/gradient/gaussgradient.zip
./Imported/gradient/gaussgradient
./Imported/gradient/gaussgradient/gaussgradient.m
./Imported/gradient/gaussgradient/README.txt.txt
./Imported/gradient/gaussgradient/testgaussgradient.m
./Hybrid
./Hybrid/cardsim_frame_shortaxis.m
./Hybrid/shuffle_transform.m
./fiesta_simulation.m

In addition, the program depends on at least one function from biosig4octmat-2.50, whose homepage is located at http://biosig.sourceforge.net. That function helps find the centre and the radius of a best fit circle/sphere for a group of points.

The directory named “Hybrid” contains functions that were written jointly and “Imported” contains functions which were brought from the outside. The core functions in the package are GPLv3-licensed and the rest are most likely to be BSD-licensed (check the sources to verify). Some of the imported functions may work only in MATLAB and not in GNU Octave, which is a free/libre substitute for MATLAB that lacks some graphical features for the most part.

HOW TO RUN THE PROGRAM

The program was written to be compatible with both Octave and MATLAB. There are some features in it that may require a UNIX/Linux system (e.g. animated videos) and some that may require MATLAB. Additionally, in order to reduce dependency on MATLAB’s GUI utilities, the program can be run in GUI and CLI modes separately, with only the use of figures being the exception to this (figures are output rather than means of interaction).

Key functions reside in the main directory of the program (one function, getdicomimages.m, is deprecated) and a directory named “GUI” contains some of the newer parts that add a GUI.

An important interface function is called fiesta_simulation.m. The first line of code in this function is a boolean flag that says whether the program should be run in GUI mode or not. If use_gui is 0, then the program will simply run the list of tasks specified below. It is possible to give several jobs for the program to complete this way, e.g. in order to run many experiments overnight. If use_gui is non-zero (probably 1 but not necessarily), then the function is assumed to have been called from the file GUI/cardiomat.m, which is a wrapper that invokes a splash screen and some dialogues that serve as a graphical interface. In turn, parameters fed to these dialogues will be passed to fiesta_simulation.m. It might be necessary to modify some paths inside the files in case the functions and the files are located in different places than the ones specified in parameters. Such paths are named in fiesta_simulation.m, loadtaggedsequence.m (specifies output directories onto which to save figures), and splash.m (looks for program images). For a new user, the only things require modifications are likely to be directory paths and maybe the use_gui boolean, depending on this user’s preference.

To run the program in GUI mode, MATLAB is needed. There is also a parameter to specify in fiesta_simulation.m in order to inform loadtaggedsequence.m whether MATLAB or Octave gets used. It is the boolean which is also the last argument in the function call, being 0 for MATLAB and 1 for Octave. The GUI front end will always pass 0 under the assumption that it is run under MATLAB.

DATASETS

The specified directories include a path from which to open images, optionally with a wildcard to filter bits contained within a given directory, e.g. selecting a subset of images that are a range of numbers. Due to privacy/data anonymity constraints, no raw data accompanies this program, even though it can definitely be obtained from many places (see for example https://schestowitz.com/Weblog/archives/2010/11/14/segmented-and-tagged-datasets/).

COMPATIBILITY

There are separate levels of compatibility dilemmas. One is the program level and another is the operating system level. Although the program has been tested in both MATLAB and Octave, on both GNU/Linux and Windows, there may be trivial code changes to make in case errors show up. Most will be path related, so it is abundantly clear that emphasis should be put on making all functions reachable from within paths definition (e.g. “addpath(genpath(YOUR_PROGRAM_ROOT_DIR_HERE))”) and booleans should be set to do the right thing (GUI/CLI and MATLAB/Octave). The goal is to ensure the program can be run under as many platforms as possible, with either free/libre or proprietary software.

IN CASE OF DIFFICULTIES

If issues running the program are experienced, please contact the author (address above). Bugs are expected to exist (it is a research purposes program, so polish is not a priority) and input is not validated or sanitised to provide virtual ‘rails’ on which the user operates the program (sane values need to be given). Sample function calls are given in fiesta_simulation.m and /Experiments/fiesta_simulation-old-experiments.m. Some of them may use the old interface and thus lack some input arguments, but most of them show the type of experiments which were run using the program.

Making My Latest Program (Cardiomat) MD-Ready

By sacrificing the comfort of the command-line interface (CLI)

Over the past few days I’ve been repackaging one of my programs such that it becomes easier to install and more user-friendly once installed. The program works in both MATLAB (proprietary software) and Octave (Free/libre software) and it now has a GUI and a name, which I arbitrarily and hastily named “Cardiomat”. Directory selection dialogues and some other user interface features are missing from Octave, so the code has become filled with some conditional statements so that it serves each user, no matter the choice of interpreters (proprietary or Free).

There are mixed feelings whenever time is dedicated to making a GUI. When a program is scriptable in the command-line sense, then it is a lot more flexible to the user and piping I/O is a lot simpler. To a new user, however, this can prove baffling. The GUI and splash screen may be necessary for medical doctors (and radiologists) to use, but it removes a lot of the power of the program, which can really end up incorporating both. When I created a 3-D othello game I made a command-line option available too as this enabled me to run simulations (e.g. game engines playing against one another) overnight, saving the results to files. With a GUI-only approach this is not possible. All my other scientific programs also had CLI interfaces which overrode or replaced the GUI. The conclusion of this whole matter is that no matter how much people like to vilify CLI ‘hackers’, those who embrace the CLI are usually in a position of advantage, especially where research is concerned. The Windows mindset requires people to repeatedly run tasks from GUIs, whereas the use of the CLI can automate all of this and provide more flexibility (I use vi as the editor for programming, still). The GUI is an area where MATLAB and Octave diverge somewhat, so here too there is a problem of universaility breaking. When one strictly sticks to the command line, there are universal interfaces and more a unified language, which tend to break if abstraction is taken that involves graphical interfaces (may also be platform dependent).

Anyway, the program can now handle anything including .bmp files and DICOM, with ginput handling image coordinate extraction (albeit bugs in Octave prevent it from working properly) and with a CLI option/fallback the program still performs the tasks it needs to. I will upload all the final source code shortly (I am the only developer, so there has been no repository yet). In future posts I am going to write about my next project and my next program, which will deal with 3-D face recognition (a departure from my current work on medical, intra-body imaging).

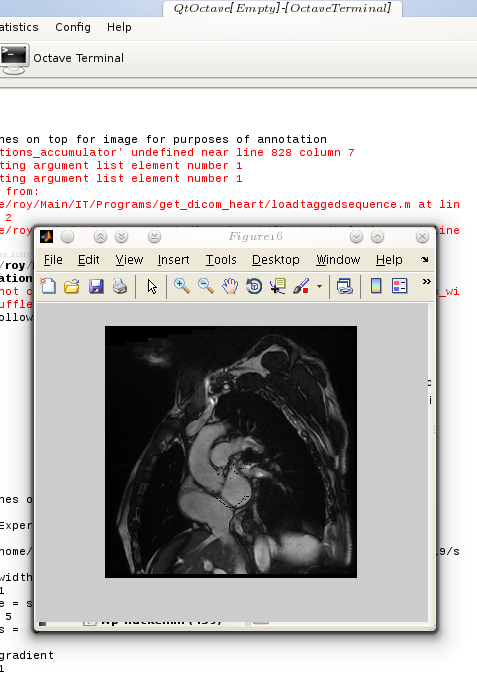
I’ve not been writing about my programming work for quite a few years (my detractors love to dig and smear me for my coding or my job), but I may try to carry on blogging about it. Here are some new screenshots:

Cardiomat directory selection

Cardiomat directory menus

Porting Code From Octave to MATLAB (or Vice Versa)

MATLAB and QtOctave
QtOctave on Kubuntu with a
MATLAB window imported from Fedora over SSH

For the sake of cross-application/framework compatibility, one occasionally needs to alter code until it works everywhere, without the need to keep two (or more) separate codebases. This situation is far from ideal, but then again, not everything works like Java. When colleagues use a different platform and occasionally prefer proprietary software it is only fair to do some extra work catering for it.

In a matter of days or maybe a few weeks I will have some new code ready for release. I had already released this before it was ready for stable usage, partly because I had not set up a proper repository, so each release of code become a manual process. This may change soon.

In the early part of the day I ensured my programs work in both MATLAB and Octave. It was not as trivial as I had expected because there is certain functionality in Octave which MATLAB simply does not support. There are notes that I took to summarise and thus simplify this task in the future. The code now works in the latest MATLAB and also in Octave, with very minor differences between these two. The same set of files can be used for both, interchangeably.

Over the course of my work I have organised the data, documentation, experimental results, and code. All of these can be neatly packaged to provide the tools necessary for others to extend the program and use it to run more experiments. Following a very thorough survey of programs that are already available around the Web, it does not appear as though opportunities to reuse code were missed. At the moment, the program has an interface function with clearly-defined inputs and its output — in the form of images and video — is sent to a directory of choice at the end.

What would be nice to attempt next is implementation of other methods that assess similarity between regions, as means of selecting points more accurately. Making the placement of points diffeomorphic so that nothing gets folded or torn between the connecting curves that make up the contours would be essential too, especially for visualisation and 3-D reconstruction for example. At the moment it is possible to take point positions at each slice and each of the 20 iterations contained for that slice and then produce — using polygons — a sort of 3-D model of the heart. This, however, would require results to be of higher precision too.

Search for Cardiac Analysis Code

During the holidays I decided to see what else is out there which is already free/libre software like my own work, which thus can be merged for comparative purposes. It would be valuable to have applied to my work some comparison to existing tracking algorithms which deal with cardiac images. A decade-old paper from Osman et al. covers the very popular HARP and states in its abstract that it offers an “image processing technique for rapid analysis of tagged cardiac magnetic resonance image sequences.[...] Results from the new method are shown to compare very well with a previously validated tracking algorithm.” It’s not easy to gain access even to code samples of complete frameworks that facilitate benchmarking, so the search ascended to SourceForge. I uploaded some projects of mine to SourceForge about 8.5 years ago and hoped that others would do the same. A search in SourceForge for “cardiac” yields about a dozen results (at the time of writing), but there are empty entries in the code repositories where there ought to be complete projects. The Cardiac MR toolbox for Matlab, for instance, is an empty project:

[roy@blueberry cmr-toolbox]$ svn co
https://cmr-toolbox.svn.sourceforge.net/svnroot/cmr-toolbox cmr-toolbox
Checked out revision 0.
[roy@blueberry cmr-toolbox]$ ls
cmr-toolbox
[roy@blueberry cmr-toolbox]$ cd cmr-toolbox/
[roy@blueberry cmr-toolbox]$ ls
[roy@blueberry cmr-toolbox]$

The same goes for Neonatal Rat Cardiac Action Potential, but the Evaluation of Cardiac MR Segmentation project (all of them written for MATLAB but ought to be compatible with Octave) contains some LGPL-licensed code. Repository access (SVN):

svn co https://cardiac-mr.svn.sourceforge.net/svnroot/cardiac-mr cardiac-mr

Looking at MATLAB Central for some more existing code I find an old BSD-licensed function but almost nothing else when searching for “Cardiac”. Since the literature review phase and the subsequent finding of some data [1, 2, 3] there has been almost no room for code reuse, so I had to code everything from scratch. I will soon publish the code (GPLv3-licensed), but in a more scientific society more code would have already been out there for others to collaborate and build upon the work of others.

Visual Tour of QtOctave

People who say that nothing can replace Photoshop and nothing can replace Microsoft Office simply forget that the functionality they must be implicily referring to is hardly used by anyone among the entire userbase. As pointed out in the previous post, two months with QtOctave and other free/libre software taught me that there is no reason to deny that ~90% of MATLAB’s users can abandon it and use free/libre software instead, maybe more happily in fact (stability, program weight, and cross-platform with access to the source code count, it’s not just a matter of cost). I have used some of the most advanced functionality in MATLAB, so I do know what I am talking about here.

Today I present free/libre software called QtOctave, which is a graphical front end to Octave and it uses Qt, as the name suggests. Qt is cross platform, so as expected it runs on Windows too. Without further ado, let’s take an overview of what QtOctave looks like. I typically put QtOctave on my eighth workspace in KDE, which helps me remember where to find it. Here is my workspace 8 (screenshot, click to magnify).

QtOctave

This picture may be daunting, but QtOctave does a good job hiding lot of the functionality under menus, which reduces clutter. QtOctave uses Octave (CLI) as its engine, but it provides a friendlier face to it. Let’s break down this picture and explain what each component does, in turn.

Menu

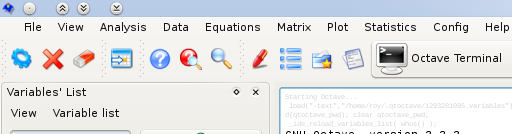
The main menu contains many of the basic functions one ought to expect. By “functions” what I mean is either functionality like opening files or mathematical functions that are commonly used. Many options there control the appearance of the GUI, whose core component of the command line containing the core, Octave. QtOctave wraps it up nicely and provides tools to work with/around it.

Menu in QtOctave

Variables

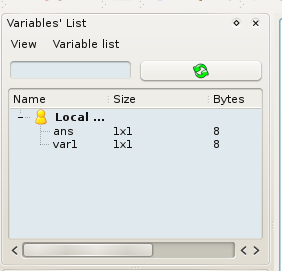
Octave exposes names and corresponding values of variables it holds, but only upon demand. How about having a GUI component to keep track of these and display this information all the time. You want it? You got it:

Variables

Commands and Dynamic Help

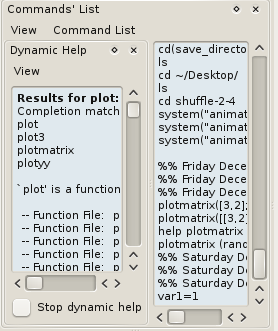
The command pane is a companion tool which helps keep track of recently-used commands and makes these conveniently available. In my case, I added the “Dynamic Help” component, to help show what commands are available as soon as I start typing. The contents in the example below show what appears in the window as soon as I began typing “plot”. The namespace of commands can be highly populated if many modules are used (in session’s path), so this is a good way to keep track without looking elsewhere. Bash has a similar functionality which it makes available via the “Tab” key.

Commands and Dynamic Help

Directories

Directories and files are sometimes easier to approach and navigate though when they are quickly accessible through the main GUI. This has use in all sorts of circumstances as drag-and-drop functionality is broadly supported.

Directories

Terminal

In the main body of the program there is the terminal section (or other components, if one chooses to make them available there). Show below is an example of basic interaction with Octave.

Terminal

CLI

The command-line interface is an integral part of the above and it supports up/down arrow key for use of commands history.

CLI

Editor Menu

This editor can be made part of the main windows, but it does not have to be. I personally choose to make it an external window on a second monitor where it offers a lot of viewing space. The menu has all one ought to expect to find in a standard text editor, but it also contains program-specific buttons like execution and debugging.

Editor Menu

Code

Here is a simple code example. The fonts that I use do not look good because I favour monospace, which helps indentation and other tasks where each character is treated as equal.

Code

Breakpoint

Here is another example of code (further down from the top). This helps show how breakpoints are represented in the editor. Together with the variables panel this provides an excellent environment for debugging, so the editor is definitely not detached from the core components; It’s custom-made for it.

Breakpoint

More Components

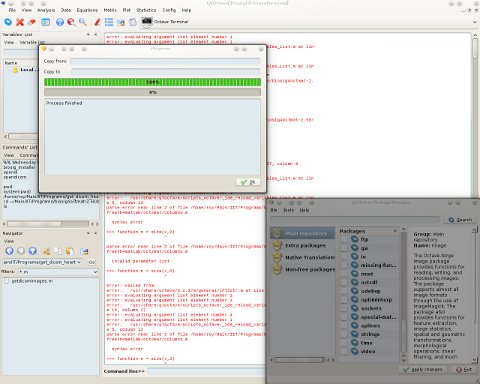
There is a lot more under the menus, e.g. package management (see the image below). But that’s a subject for another day.

Octave packages

If you like what you see in QtOctave, then consider giving Octave a look. Both Octave and QtOctave are in the *Ubuntu and Fedora repositories, so they only take a moment to install.

Heart Image Contouring

Today I implemented circular arrangement of landmark points for the algorithm to identify something approximate/similar to the shape of the heart and then place a given number of points around there. In addition, a boundary is shown by sampling between those points, which gives a contour, with or without arrows on top of it. I will upload the code shortly (needs tidying up).

Heart Tracking – Arrows Drawn Pixel by Pixel

Cardiac image with movement - arrows in blue

Cardiac image with movement - arrows in red

Rather than use the line function in Octave I’ve created a function that can draw several types of arrow, either with colour gradients or uniform, thick or thin (these are parameterised). I’ll soon publish the code.

The shown above arrows are very tiny, but there is a small arrowhead that tells which direction the points move in. Additionally, I have been implementing some 3-D means of visualising what is being done, but it is too early to show the results of this, possibly with arrows in hyperspace too.

These new exemplary images show a surface yielded with ‘hot’ colours where I move landmark points in between frames. It’s still work in progress.

Retrieval statistics: 21 queries taking a total of 0.103 seconds • Please report low bandwidth using the feedback form
Original styles created by Ian Main (all acknowledgements) • PHP scripts and styles later modified by Roy Schestowitz • Help yourself to a GPL'd copy
|— Proudly powered by W o r d P r e s s — based on a heavily-hacked version 1.2.1 (Mingus) installation —|