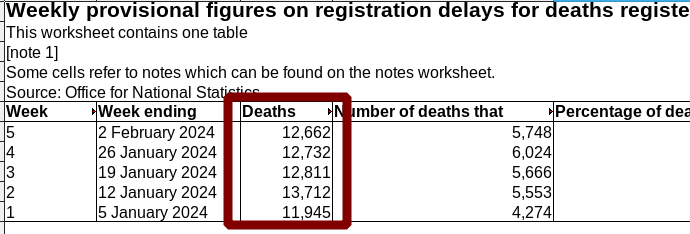
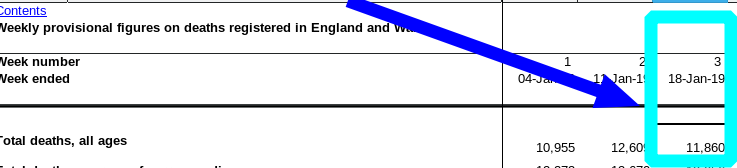
Christmastime England and Wales Deaths: From 11.2k to 13.2k (Before and ‘After’ Pandemic)
Pandemic not over, this is not normal:
Week 51 noted.
It was 11.5k in 2014-2019 or about 11.2k in 2014-2018 (before COVID-19).
Pandemic not over, this is not normal:
Week 51 noted.
It was 11.5k in 2014-2019 or about 11.2k in 2014-2018 (before COVID-19).
Open access using this link:
https://onlinelibrary.wiley.com/doi/10.1111/eci.14136
Effectiveness of a fourth SARS-CoV-2 vaccine dose in previously infected individuals from Austria
Evidence is limited on the effectiveness of a fourth vaccine dose against coronavirus disease 2019,
in populations with prior SARS-CoV-2 infections.
We estimated the risk of COVID-19 deaths (primary outcome)
We estimated the risk of SARS-CoV-2 infections (secondary outcome)
Methods
Austria nationwide retrospective observational study.
1 November to 31 December 2022
Primarily comparing individuals with four versus three vaccine doses.
Whole population data.
Results
3,986,312 previously infected individuals
281,291 (7,1%) had four vaccinations at baseline
1,545,242 (38.8%) had three vaccinations at baseline
We recorded
69 COVID-19 deaths
89,056 SARS-CoV-2 infections
The majority of COVID-19 deaths and a significant proportion of all-cause deaths occurred in nursing home residentsRelative vaccine effectiveness (rVE) for four versus three vaccine doses
-24% against COVID-19 deaths
17% against SARS-CoV-2 infections.
Protection against infection rapidly diminished over time,
and infection risk with four vaccinations was higher during extended follow-up until June 2023.
Adjusted HR for all-cause mortality for four versus three vaccinations was 0.79.
That is people with a 4th dose were only 79% as likely to die
(Suggesting healthy vaccinee bias, i.e. healthier persons received more vaccine doses)Discussion
In previously infected individuals, a fourth vaccination did not reduce COVID-19 death risk,
but with transiently reduced risk of SARS-CoV-2 infections,
and reversal of this effect in longer follow-up.
All-cause mortality data suggest healthy vaccinee bias.
More details
Mostly Pfizer vaccine, some Moderna
In this study, overall case fatality rate, 0.08%.
(IFR, ? 0.008% if 10% of infections picked up)
Individuals with repeated previous infections had reduced re-infection risk
Natural immunity may be a main determinant of immunological protection in a population
By end 2022, the vast majority of the global population had already acquired some immune protection
Compared to three vaccine doses, those with fewer or no vaccinations did not differ with regard to COVID-19 mortality,
but had reduced risk of SARS-CoV-2 infections.
In 2022, infection fatality rates due to SARS-CoV-2 significantly declined suggesting transitioning into endemicity.
In general, our study results question whether recommendations for repeated vaccine boosters against SARS-CoV-2 are currently justified for large parts of the general population with a history of previous infections.
Measures against SARS-CoV-2 including vaccine policy should be critically re-assessed for their risk-to-benefit ratio.
As most SARS-CoV-2 infections are asymptomatic or mild in an endemic phase,
effectiveness of vaccinations should be primarily evaluated according to hard clinical outcomes (e.g. COVID-19 deaths)
Extended follow-up
From 1 January to 30 June 2023
Omicron XBB.1.5. was the predominant variant
225 COVID-19 deaths
174,174 SARS-CoV-2 infections.
Analyses in 2023 confirm no relative vaccine effectiveness (rVE) for four versus three vaccine doses for COVID-19 mortality,
but show higher risk of SARS-CoV-2 infections with a rVE of ?17%
They would never hold corporations (with secret deals) accountable for anything.
Excess deaths by week, 2023
https://data-explorer.oecd.org
https://stats.oecd.org/index.aspx?queryid=104676
Australia, weeks 1 – 34, 2023
14,710 (16.8%)
Covid deaths, 4,977
Australia, 2022, weeks 1 – 52
29,738 (18.7%)
Australia, excess deaths
2022 + 2023 = 44,448Austria, week 1 – 44, 2023
4,444 (6.5%)
Canada, weeks 1 – 33, 2023
28,400 (16.7%)
Covid deaths, 4,613
Canada, 2022
61,468 (22.3%)
Canada, excess deaths
2022 + 2023 = 89,868Denmark, weeks 1 – 44, 2023
3,052 (6.9%)
Covid deaths, 347
Denmark, 2022
5,871 (11%)
Denmark, excess deaths
2022 + 2023 = 8,923Finland, weeks 1 – 44, 2023
4,627 (10.5%)
France, weeks 1 – 44, 2023
22,268 (4.9%)
Covid deaths, 5,565
France, 2022
71,751 (11.9%)
Germany, weeks 1 – 44, 2023
59,039 (7.7%)
Germany, 2022
134, 578 (14.9%)
Greece, weeks 1 – 44, 2023
5,132 (5.2%)
Iceland, weeks 1 – 44, 2023
209 (11.5%)
Covid deaths, 0
Iceland, 2022
446 (20.2%)
Israel, weeks 1 – 44, 2023
4,303 (11.8%)
Covid deaths, 640
Israel, 2022
7,050 (15.4%)
Italy, weeks 1 – 44, 2023
938 (0.28%)
Netherlands, weeks 1 – 44, 2023
14,209 (11.3%)
Netherlands, 2022
19,326 (13.2%)
New Zealand, weeks, 1 – 44, 2023
3,960 (14.5%)
New Zealand, 2022
5,787 (17.6%)
Norway, weeks 1 – 44, 2023
1,885 (5.7%)
Norway, 2022
4,980 (12.5%)
Portugal, weeks 1 – 44, 2023
5,184 (6.3%)
Spain, weeks 1 – 44, 2023
11,948 (3.7%)
Switzerland, 1 – 44, 2023
2,063 (3.9%)
UK, weeks 1 – 44, 2023
49,389 (9.44%)
Covid deaths, 18,591
UK, 2022
52,514 (9.26%)
UK excess deaths
2022 + 2023 = 101,903Height of the Blitz, September 1940 to May 1941
UK civilian deaths, 40,000
Total civilian deaths for WW2, 70,000
US, weeks 1 – 37, 2023
155,763 (7.8%)
Covid deaths, 76,187
US, 2022
495,749 (17.53)
US excess deaths
2022 + 2023 = 651,512Total US deaths in Vietnam war
The U.S. National Archives shows that 58,220 U.S. soldiers perished.
https://www.worldatlas.com/articles/how-many-americans-were-killed-in-the-vietnam-war.html
Hungary, weeks 1 – 44, 2023
-3,785 (-3.2%)
Poland, weeks 1 – 43, 2023
104 (0.13%)
Slovak republic, weeks 1 – 43, 2023
-774 (-1.54%)
Sweden, weeks 1 – 44, 2023
-529 (0.6%)
COVID, the untold story. So much more makes sense after this book and my first illuminating discussion with Dr. Craig. Get your copy in the UK here:
https://www.amazon.co.uk/Expired-untold-Dr-Clare-Craig/dp/1739344707
For friends in the US get your copy here, https://www.amazon.com/Expired-untold-Dr-Clare-Craig/dp/1739344707
This dataset presents the latest data on All-cause death statistics
Excess mortality and COVID-19 deaths, by week, for all OECD countries for which data are available.
The expected number of deaths is based on the average number of deaths for the same week, (2015-19)
This baseline could be considered a lower estimate of the expected number of deaths since both population growth and an ageing population would be expected to push up the number of deaths observed each year.
For example, New Zealand saw its population grow by around 9% since 2015, with the number of people aged 65 and over increasing by 18%.
“Soften the news”
‘a threatening phone call’
https://www.telegraph.co.uk/news/2023/11/08/how-astrazeneca-vaccine-was-shelved/
8th November 2023
In March 2021, The Telegraph was one of the first newspapers to imply a causal link between the jab and blood clots after Norwegian scientists suggested a possible mechanism.
On the day we published the story we received a threatening phone call from a senior official at the MHRA warning that The Telegraph would be banned from future briefings and press notices if we did not soften the news.
https://www.gov.uk/government/organisations/medicines-and-healthcare-products-regulatory-agency
From FDA to MHRA: are drug regulators for hire?
https://www.bmj.com/content/377/bmj.o1538
June 2022
Industry money saturates the globe’s leading regulators.
The BMJ found that the majority of regulators’ budget—particularly the portion focused on drugs—is derived from industry fees
Another well-known Cambridge academic got in touch to complain about our “disgraceful fear-mongering headline” on the story, claiming that it would discourage vaccine uptake and cost lives.
We politely pointed out that hiding the facts from people was not helpful and could also cost lives. The academic did not respond.
In February this year, TikTok removed an audio clip in which I discussed whether the benefit of vaccination was worth the risks for young people, claiming it had breached community guidelines.
After we showed that the Government’s own website acknowledges the link, the clip was reinstated.
All of this shows a troubling paternalism in government, academia and some media outlets who believe that the public is not capable of weighing up the pros and cons of medical interventions and so must be shielded from the truth.
Excess mortality in England post Covid-19 pandemic: implications for secondary prevention
https://www.sciencedirect.com/science/article/pii/S2666776223002211?via%3Dihub
Many countries, including the UK, have continued to experience an apparent excess of deaths long after the peaks associated with the COVID-19 pandemic in 2020 and 2021.
Numbers of excess deaths estimated in this period are considerable.
The UK Office for National Statistics (ONS) has calculated that there were 7.2% or 44,255 more deaths registered in the UK in 2022
OECD, UK
https://stats.oecd.org/index.aspx?queryid=104676
Excess deaths in 2022, 52,514 (9.26%)
This persisted into 2023 with 8.6% or 28,024 more deaths registered in the first six months of the year than expected.
OECD, UK, weeks 1 – 44, 2023
Excess deaths, 49,389 (9.44%)
The causes of these excess deaths are likely to be multiple and could include the direct effects of Covid-19 infection,
acute pressures on NHS acute services resulting in poorer outcomes from episodes of acute illness,
and disruption to chronic disease detection and management.
Further analysis by cause and by age- and sex-group may help quantify the relative contributions of these causes.
Office for Health Improvement and Disparities
3rd June 2022 to 30th June 2023
Excess deaths for all causes were relatively greatest for 50–64 year olds (15% higher than expected)
11% higher for 25–49 and under 25 year olds,
and about 9% higher for over 65s
Several causes
3rd June 2022–30th June 2023
All cardiovascular diseases, 12%
Heart failure, 20%
Ischaemic heart disease, 15
Liver diseases, 19%
Acute respiratory infections, 14%
Diabetes, 13%
For middle-aged adults (50–64)
Cardiovascular diseases, 33% higher than expected
Ischaemic heart disease, 44%
Cerebrovascular disease, 40%
Heart failure 39% higher
Deaths involving acute respiratory infections, 43% higher
Diabetes, deaths were 35% higher
The pattern now is one of persisting excess deaths which are most prominent in relative terms in middle-aged and younger adults
Timely and granular analyses are needed to describe such trends and so to inform prevention and disease management efforts.
JP-S is Partner at Lane Clark & Peacock LLP, Chair of the Royal Society for Public Health and reports personal fees from Novo Nordisk and Pfizer Ltd outside of this submitted work.
N the months of December-January/February there are typically many deaths due to the low temperatures, but it is all relative in the northern hemisphere (climate and general population age/health as factors, comparing year to year by the week).
Today’s new data from ONS adds Week 49 to the record, showing 11,318 deaths in England and Wales this year compared to 10,585 in 2014-2019 on average. In 2019 COVID-19 was already here, resulting in 10,816 deaths. So the true pre-COVID-19 figure would be 2014-2018 or about 10,450 – i.e. almost 1,000 more deaths than this year’s Week 49.
More of the same. No recovery seen. The population here did not grow 10% since the pandemic started.
aving just repeatedly refreshed this page in pursuit of the latest numbers (usually due 9:30AM every Tuesday), I can finally see that in Week 48 the number of recorded deaths in England and Wales is 11,385.
Before COVID-19 (2014-2019 average) it was 10,164.
That’s an increase of 1221 (actual people!) or 12.01%.
In November (the end of the month) COVID-19 had already begun spreading worldwide, so the number of deaths in 2019 was 10,958. This means that an increase of a lot more than 12% can be measured by leaving out 2019.
‘ve checked the latest numbers released today (12 December 2023) by ONS, which almost every week publishes “[p]rovisional counts of the number of deaths registered in England and Wales, by age, sex and region, in the latest weeks for which data are available. Includes the most up-to-date figures available for deaths involving coronavirus (COVID-19).”
Before COVID-19 the mortality level for the country was a lot lower. With new numbers due soon (mortality), let’s consider what it looked like in 2014-2019, January until October (when COVID-19 is said to have broken out in China).
From January 4th until October 4th: 405,046 deaths across England and Wales.
This year, as per the latest figures from ONS, January 6th until October 6th: 449,555 deaths across England and Wales.
That’s almost 50,000 more deaths, with 2 more months left in the year.
One can imagine the surplus by year’s end will be around 55,000.
These are not mere statistics. They represent actual lives lost and devastated relatives.
I just want to thank the NHS for still persisting, despite the government’s attack on this invaluable public service (an attack whose goal to push privatised replacements).
Retrieval statistics: 21 queries taking a total of 0.082 seconds • Please report low bandwidth using the feedback form
Original styles created by Ian Main (all acknowledgements) • PHP scripts and styles later modified by Roy Schestowitz • Help yourself to a GPL'd copy
|— Proudly powered by W o r d P r e s s — based on a heavily-hacked version 1.2.1 (Mingus) installation —|