Wednesday, October 26th, 2022, 2:05 am
Chart: England and Wales Deaths (Totals) in 2014-2019 (Average), 2021, and 2022
Spoiler: we’re seeing about 2,000 more deaths than usual per week, including in many young people.
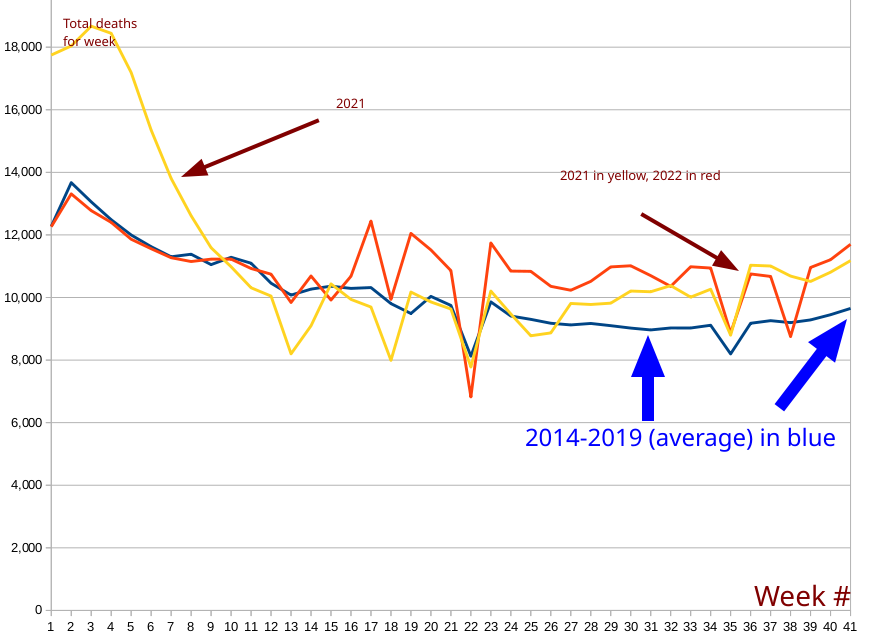
Chart data and the chart itself (as ODF): # of deaths chart, per week. Data from ONS.
This entry was posted
on Wednesday, October 26th, 2022 at 2:05 am and is filed under Health, Science.
You can follow any responses to this entry through the RSS 2.0 feed.
You can leave a response, or trackback from your own site.
Technical Notes About Comments
Comments may include corrections, additions, citations, expressions of consent or even disagreements. They should preferably remain on topic.
Moderation: All genuine comments will be added. If your comment does not appear immediately (a rarity), it awaits moderation as it contained a sensitive word or a URI.
Trackbacks: The URI to TrackBack this entry is:
https://schestowitz.com/Weblog/archives/2022/10/26/deaths-in-uk/trackback/
Syndication: RSS feed for comments on this post 
See also: What are feeds?, Local Feeds
Comments format: Line and paragraph breaks are automatic, E-mail address never displayed, HTML allowed: <a href="" title=""> <abbr title=""> <acronym title=""> <b> <blockquote cite=""> <cite> <code> <del datetime=""> <em> <i> <q cite=""> <strike> <strong>


 Filed under: