Introduction About Site Map

XML
RSS 2 Feed RSS 2 Feed
Navigation

Main Page | Blog Index

Archive for October, 2022

CDC Data: US Deaths About 25% Higher This Winter Than Last Winter Before COVID-19 (Updated)

Latest data as ODF (via: By state and totals

Number of deaths 2018 and 2019:

2019 March 253,000
2019 February 232,000
2019 January 257,000

2018 December 249,000
2018 November 233,000
2018 October 234,000
2018 September 219,000
2018 August 224,000
2018 July 225,000
2018 June 220,000
2018 May 229,000
2018 April 233,000
2018 March 249,000
2018 February 237,000
2018 January 287,000

Compare to the ODF above (it goes up until March 2022)

January-March 2018: 287,000, 237,000, 249,000
January-March 2019: 257,000, 232,000, 253,000 (total: 742,000)
January-March 2021: 373,000, 282,000, 270,000
January-March 2022: 368,000, 288,000, 266,000 (total: 922,000)

922,000 is 24.2% more than 742,000.

Update: 2016 and 2017 figures show that compared to 2016 (202,000 deaths fewer than 2022) there is a 27.2% increase.

The numbers are:

January-March 2016: 246,000, 230,000, 244,000
January-March 2017: 263,000, 234,000, 251,000

The differences are profound.

An Australian COVID-19 Surge

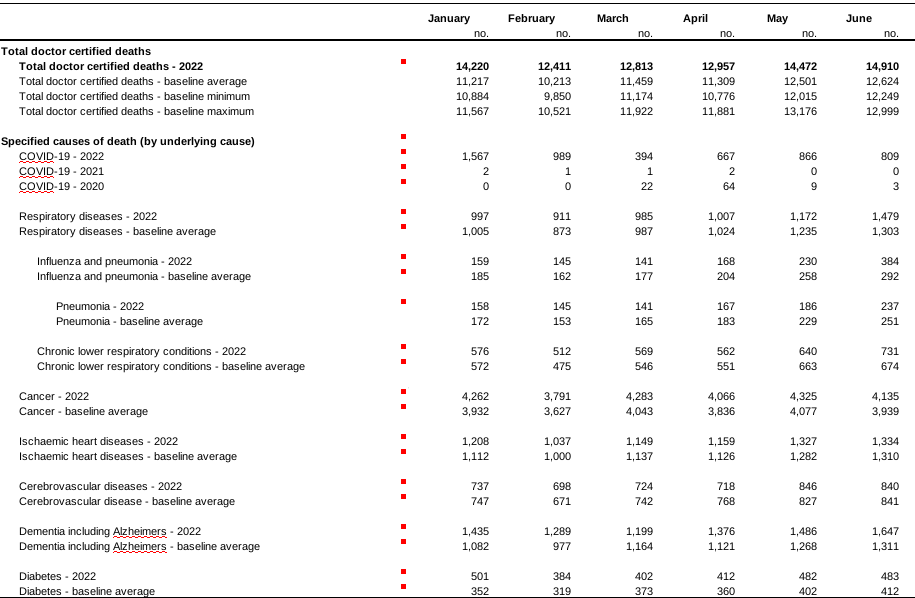
Given this video and this data, it was interesting to see what proportion of Australian deaths can be connected to COVID-19 (in a mostly COVID-vaccinated population).

Causes of death this year:

Causes of death

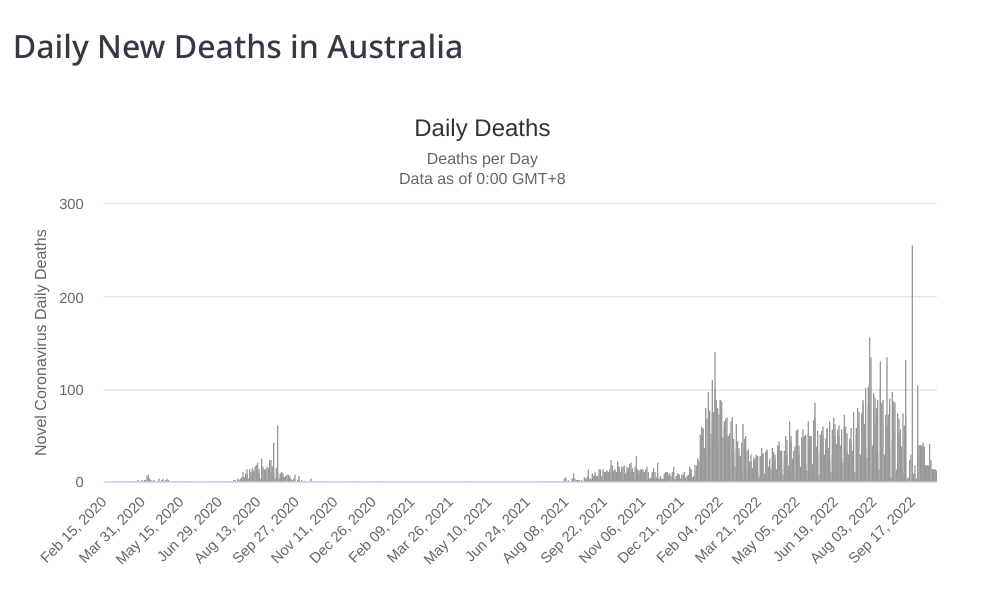
COVID-19 deaths over the years:

australia-deaths-graph

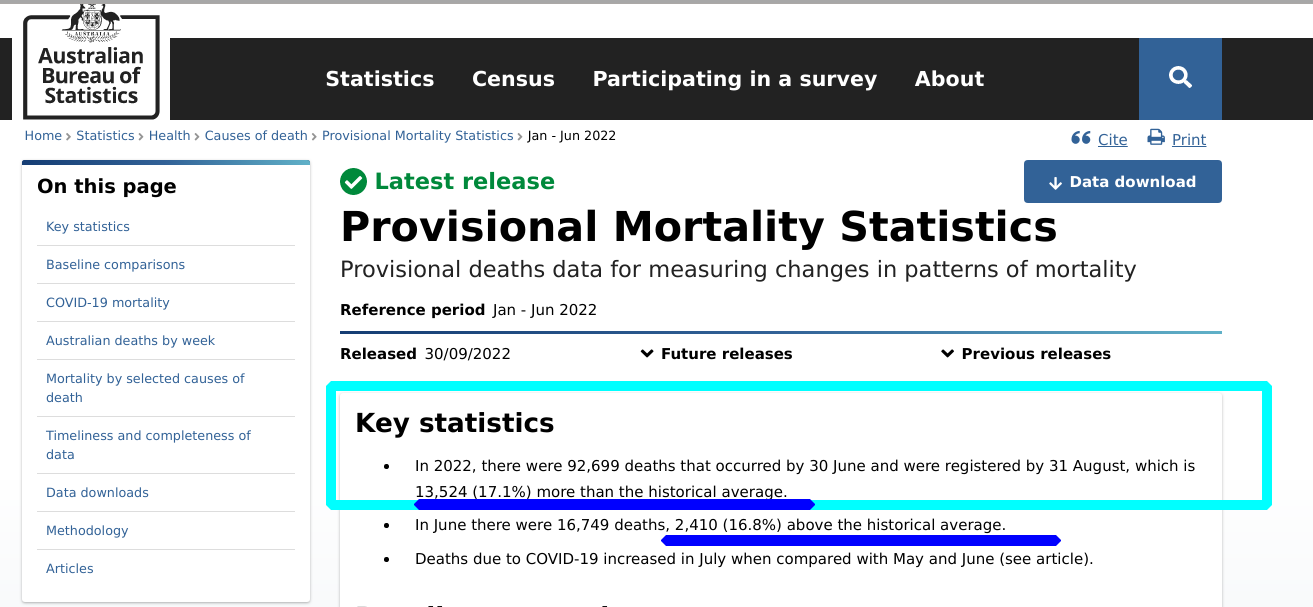
Australia Reports 17.1% More Deaths Than the Historical Average Following the COVID-19 Wave, Let’s Look at the Data

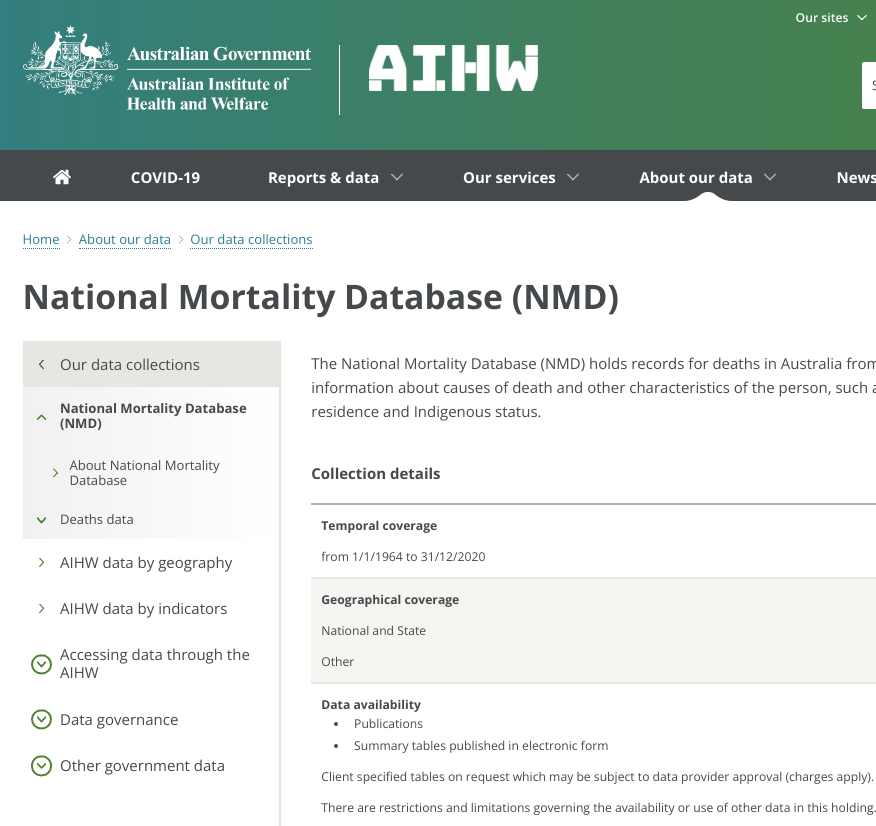
After this video I’ve decided to look closely at the underlying data, which was put online a couple of weeks ago. I wanted to know how big an impact could be seen in younger people, knowing that COVID-19 mostly kills old people. At first I found this page:

Australia data

I then checked about a dozen pages there, but no actual data is being provided (like a download link). Disappointing.

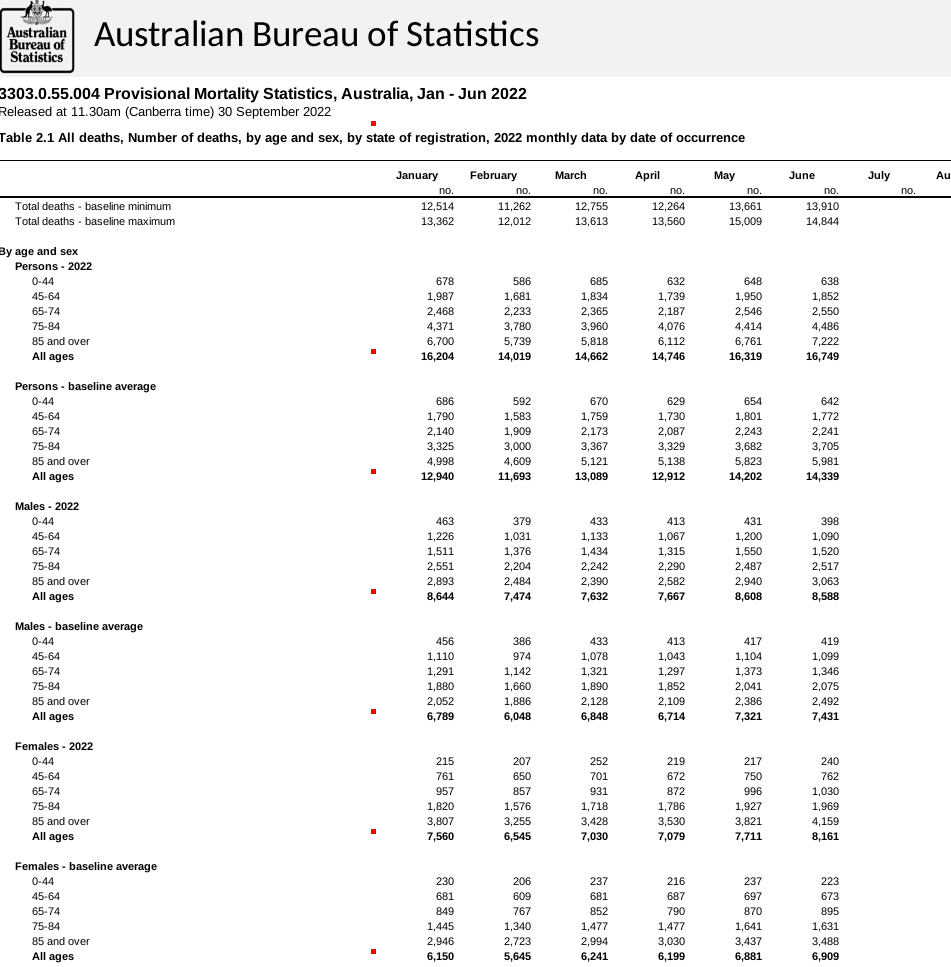
But aihw.gov.au seems like the wrong place to check. abs.gov.au is where the detailed data is. They released some new data along with a summary as follows:

Australia official

Sadly, they use proprietary Microsoft formats (foreign company that bribes and attacks standards), so I’ve converted all the files to ODF.

I’ve fused together past (historical) data with the first 6 months of this year and here’s what I found:

Aussie data sliced

Younger groups’ deaths data. Those are totals.

Younger groups' deaths data

The data sliced some more.

Demonstrating high number of deaths

Demonstrating high number of deaths.

Demonstrating high number of deaths

So it seems skewed towards more excess deaths among people over 45, but among the younger groups deaths have increased as well.

Data

COVID-19 Waves Leave People Dying in Much Bigger Numbers

Published a short while ago.

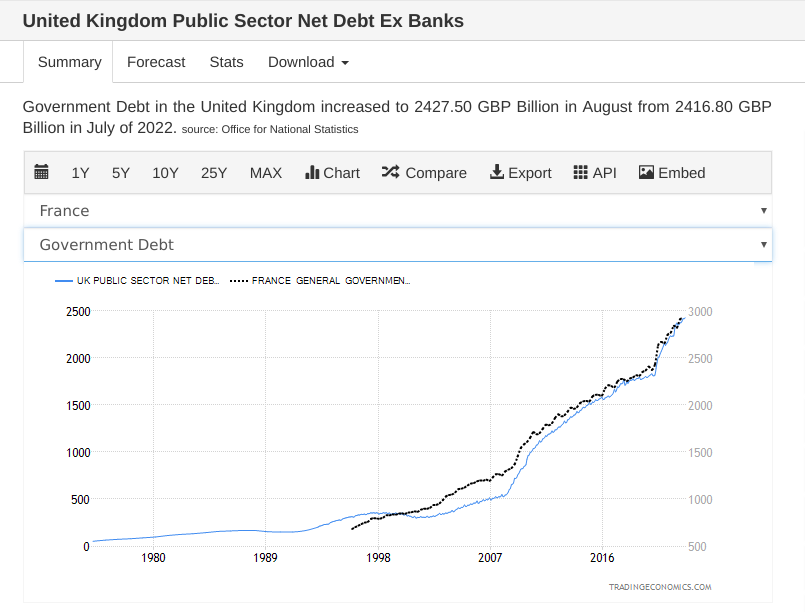
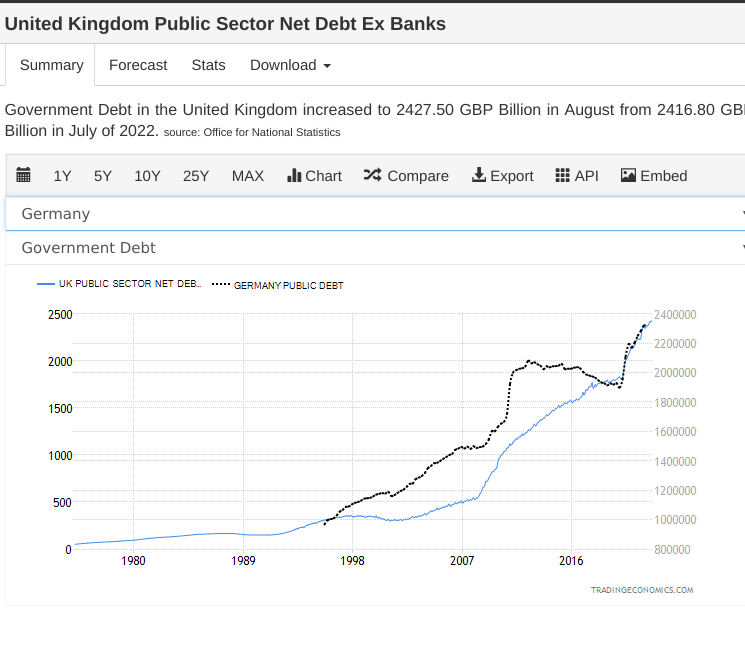
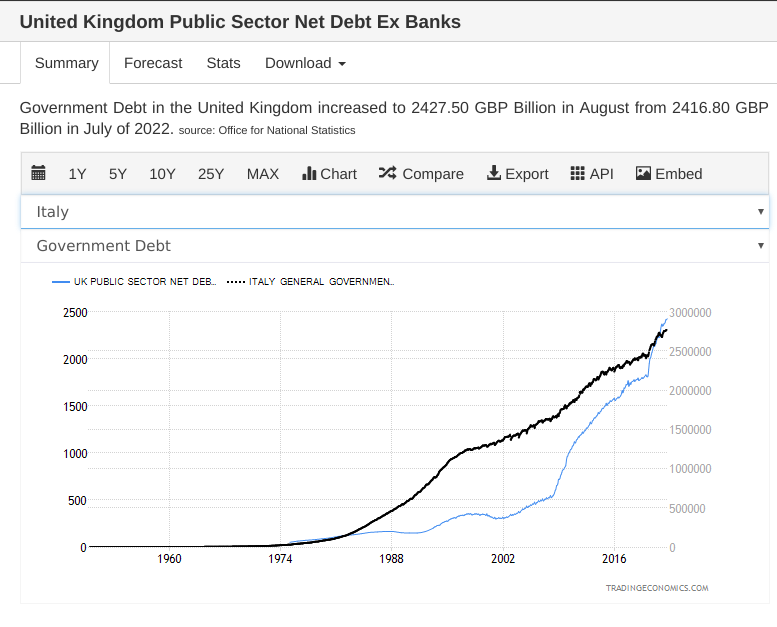
National (Public) Debt Curves Compared: UK vs France, Germany, Italy, and US

Debt: UK vs France

Debt: UK vs Germany

Debt: UK vs Italy

Debt: UK vs US

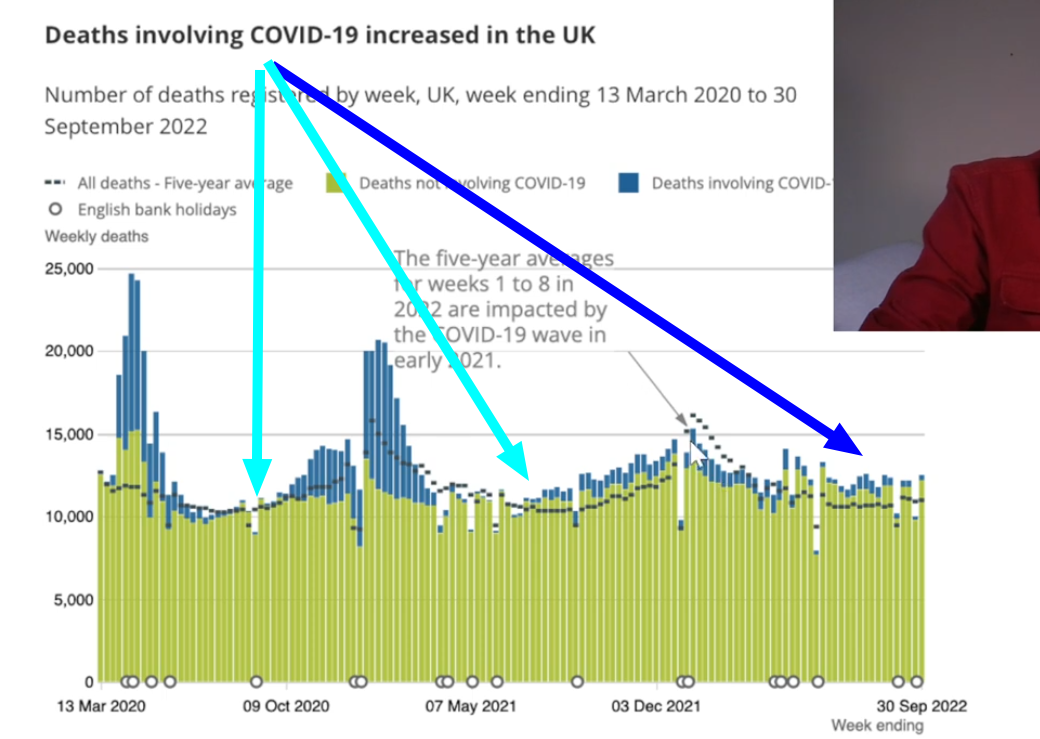
Graph: Deaths Involving COVID-19 Increased in the UK

Published 4 hours ago:

Important visualisation:

COVID-19 deaths increasing

Deaths Rose Sharply This September Compared to Prior Septembers (More Than 10% Higher Than in 2020)

Deaths across the UK are very concerning. We’ve not seen numbers like these before. I wrote about it at the start of this week because the trend isn’t limited to summer. The heatwaves cannot be blamed for it. It’s so bad that mortality in my age group rose 10% (yes, 10%!) and now have complete figures for September 2022 (update and released 2 days ago). This is what it looks like.

September 2018 deaths by week in England and Wales:

9,445 9,191 9,305 9,150

September 2019 deaths by week in England and Wales:

9,695 9,513 9,440 9,517

September 2020 deaths by week in England and Wales:

7,739 9,811 9,523 9,634

September 2021 deaths by week in England and Wales:

8,797 11,035 11,009 10,684

September 2022 deaths by week in England and Wales:

10,753 10,673 8,751 10,960

Sum for September per year (note: they break it down by week, not month)
2018: 37091
2019: 38165
2020: 36707
2021: 41525
2022: 41137

As charts:

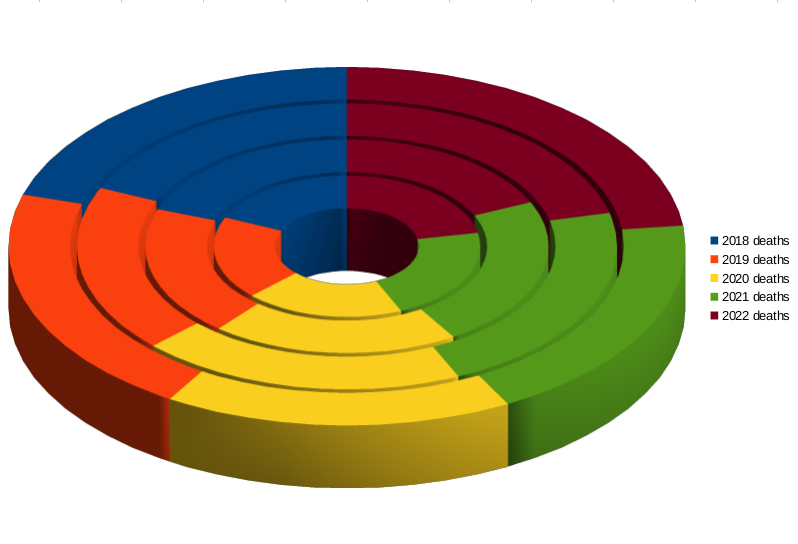
Deaths bars

COVID-19 deaths

As spreadsheet (ODF): September deaths (with charts)

Retrieval statistics: 18 queries taking a total of 0.141 seconds • Please report low bandwidth using the feedback form
Original styles created by Ian Main (all acknowledgements) • PHP scripts and styles later modified by Roy Schestowitz • Help yourself to a GPL'd copy
|— Proudly powered by W o r d P r e s s — based on a heavily-hacked version 1.2.1 (Mingus) installation —|