Introduction About Site Map

XML
RSS 2 Feed RSS 2 Feed
Navigation

Main Page | Blog Index

Archive for the ‘Health’ Category

How 2023 (When They Tell Us Pandemic is Over) Compares to 1999-2018 Death Rates

tl;dr We are not back to normal, the “new” normal is a lot of death.

Here is the chart (notice the death levels on the right compared to the left, before and ‘after’ pandemic)

The new normal in 2023

Source data: original PDF from this page; it is compared to numbers from 2023 and 2022

Death Levels Sharply Above Pre-COVID-19 Levels

Even if the media does not talk about this (or belittles the whole thing)…

ONS deaths 2022 and 2023

ONS deaths 2019

I 
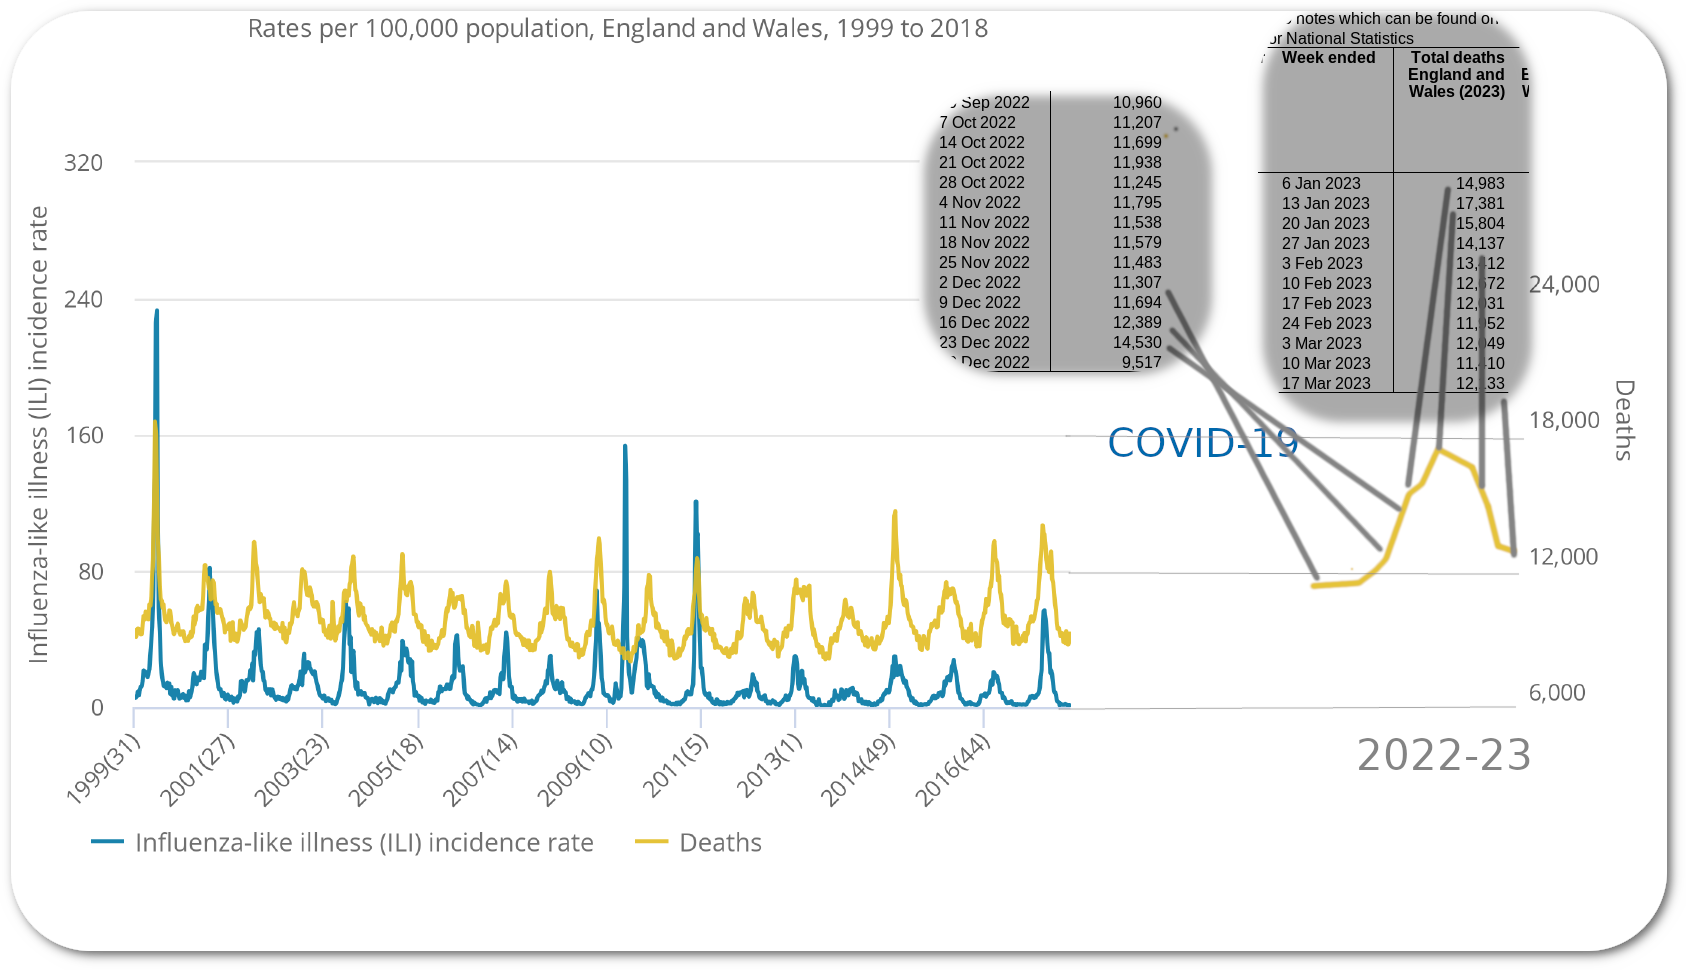
AM sad about this, but I am not shocked.

10 minutes ago ONS released the latest mortality numbers for England and Wales. This update is a weekly occurrence (typically 10AM ish every Tuesday).

Total deaths week 11 in 2019: 10,567. Total deaths week 11 in 2022: 10,928. Total deaths week 11 in 2023: 12,133. Pandemic is over, folks. Go back your office cage and don’t wear a mask or anything. COVID-19 is both “mild” and “long” now.

In First Two Months of 2023 More Than 20,000 ADDITIONAL Welsh and English People Died (Above Pre-Pandemic Levels)

Should we expect an increase of about 120,000 annual deaths? Is this considered the “new normal”?

T
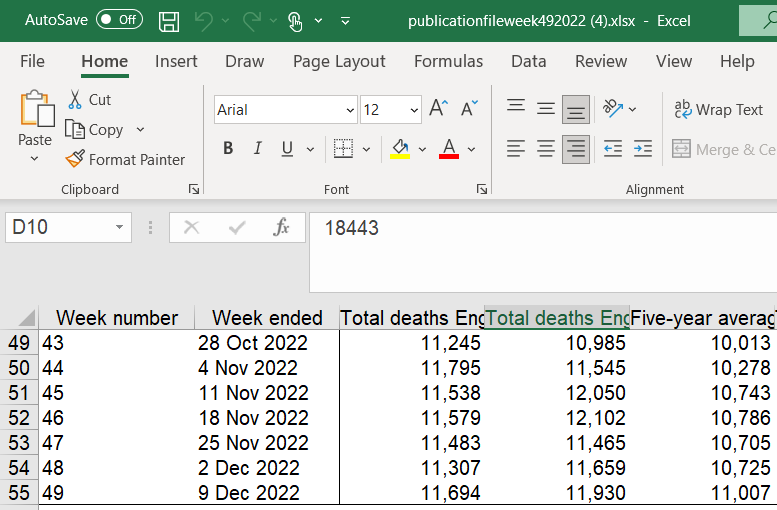
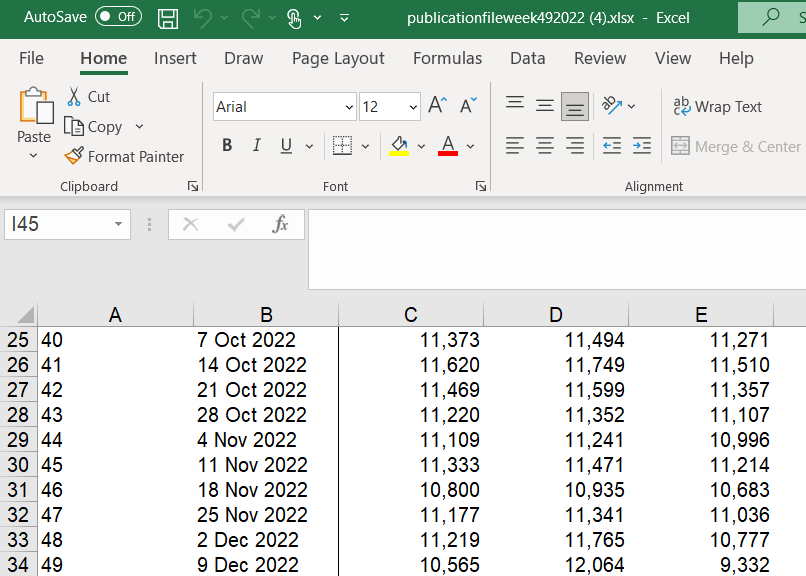
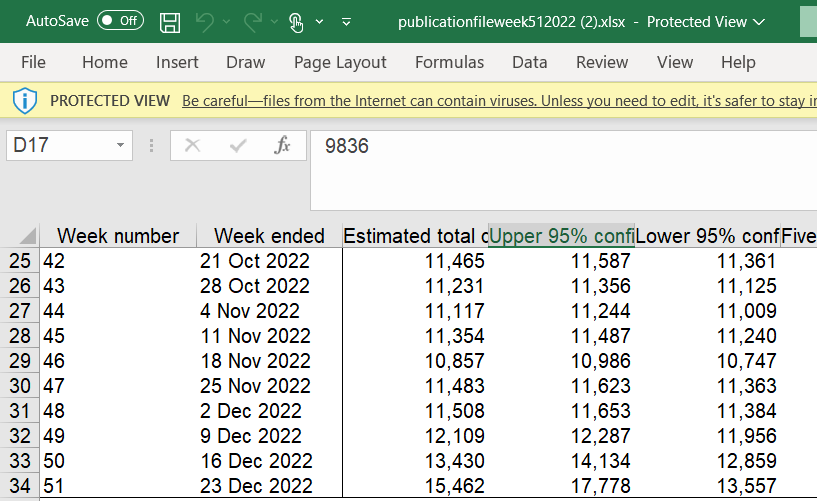
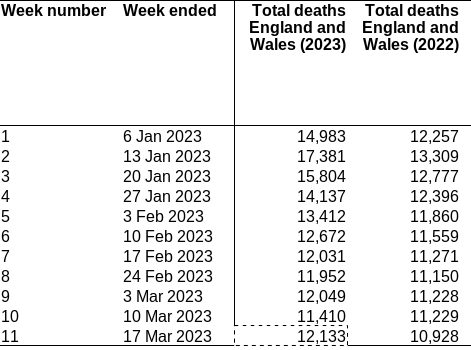
uesday’s ONS figures (tomorrow around 10AM) will show if we still have infamous (major increase of about 20%) excess mortality/death levels.
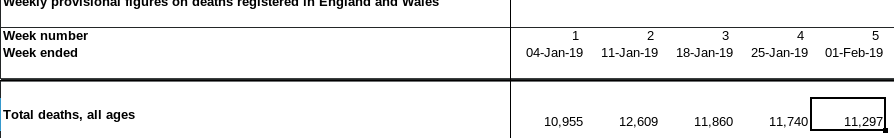
 So far every week (for this year) looks rather bad; so far…

Official government data:

Deaths by 6 Jan 2023 14,983 compared to 10,955 in 2019
Deaths by 13 Jan 2023 17,381 compared to 12,609 in 2019
Deaths by 20 Jan 2023 15,804 compared to 11,860 in 2019
Deaths by 27 Jan 2023 14,137 compared to 11,740 in 2019
Deaths by 3 Feb 2023 13,412 compared to 11,297 in 2019
Deaths by 10 Feb 2023 12,672 compared to 11,660 in 2019
Deaths by 17 Feb 2023 12,031 compared to 11,824 in 2019
Deaths by 24 Feb 2023 11,952 compared to 11,295 in 2019
Deaths by 3 Mar 2023 12,049 compared to 11,044 in 2019

2019 total: 104,284 (first 9 weeks alone)
2023 total: 124,421 (first 9 weeks alone)

That’s an increase of more than 20,000.

Multifocal Necrotizing Encephalitis and Myocarditis (Brain and Heart Damage) After BNT162b2 mRNA Vaccination Against COVID-19

New (but not in the mainstream media, just in scientific literature)

Description reproduced in case Google censors his videos again:

Multifocal Necrotizing Encephalitis and Myocarditis after BNT162b2 mRNA Vaccination against COVID-19, (1 October 2022)

www.mdpi.com/2076-393X/10/10/1651

76-year-old man with Parkinson’s disease

Died three weeks after third COVID-19 vaccination

May 2021, ChAdOx1 vaccine

July 2021, Pfizer vaccine

December 2021, Pfizer vaccine

Family of the deceased requested an autopsy,

due to ambiguous clinical signs before death.

PD was confirmed by post-mortem examinations.

Signs of aspiration pneumonia and systemic arteriosclerosis

Histopathological analyses of the brain

Acute vasculitis (predominantly lymphocytic)

Multifocal necrotizing encephalitis

Pronounced inflammation

Glial and lymphocytic reaction

In the heart

Signs of chronic cardiomyopathy

Mild acute lympho-histiocytic myocarditis and vasculitis

Patient had no history of COVID-19

Immunohistochemistry for SARS-CoV-2 antigens (spike and nucleocapsid proteins) was performed.

Only spike protein but no nucleocapsid protein could be detected,

within the foci of inflammation, brain and heart

Spike protein detected in the endothelial cells of small blood vessels.

Quotes from the paper

Since no nucleocapsid protein could be detected, the presence of spike protein must be ascribed to vaccination rather than to viral infection.

The findings corroborate previous reports of encephalitis and myocarditis caused by gene-based COVID-19 vaccines.

A causal connection of these findings to the preceding COVID-19 vaccination was established by immunohistochemical demonstration of SARS-CoV-2 spike protein.

The methodology introduced in this study should be useful for distinguishing between causation by COVID-19 vaccination or infection in ambiguous cases.

Clinicians should take note of such case reports for the sake of early detection and management of such adverse events among their patients.

A thorough post-mortem examination of deaths in connection with COVID-19 vaccination should be considered in ambiguous circumstances, including histology.

Clinical History

First vaccination in May 2021 (ChAdOx1)

He experienced pronounced cardiovascular side effects

After the second vaccination in July 2021 (BNT162b2)

Family noted obvious behavioral and psychological changes (e.g., he did not want to be touched, anxiety, lethargy, social withdrawal)

Striking worsening of his PD symptoms

2 weeks after the third vaccination

Suddenly collapsed

Collapsed again 2 weeks after, died shortly thereafter

Clinical diagnosis was death due to aspiration pneumonia.

So Far This Year 75,717 Deaths in England and Wales, Compared to 58,461 in the Same Period in 2019

I HAVE just grabbed the latest data, which was published 20 minutes ago. Be careful not to read government spin or ONS’s attempt to ‘editorialise’ this data, basically comparing peak pandemic years to the present instead of pre-pandemic times. Here are the numbers of deaths for 2019:

2019 deaths

Compare to 2023:

2023 deaths

That’s an increase by 29.51% or 30% if you round it up.

Here is the official data:

It’s hard to trust the government on such stuff because it was complicit in a botched reponse and would rather cover up not just what happened in the past but what is happening at present.

England and Wales (Most of UK) Deaths Rose From 11,740 in 2019 to 14,137 in the Same Period This Year

Sarah Caul’s (ONS) latest update is rather misleading. It says: “In the week ending 27 January 2023 (Week 4), 14,137 deaths were registered in England and Wales; 579 of these deaths mentioned “novel coronavirus (COVID-19)”, accounting for 4.1% of all deaths.”

They then try to present it a) as a decline (compared to winter’s peak, not compared to prior years) and b) nothing to do with COVID-19.

Comparing this data to pre-COVID-19 levels, we actually see an increase of 20.41%.

Nice “end of pandemic” you got there… I’ve not compared by age groups, but if prior weeks’ data can be considered something to judge by, this impacts all age groups. Not good.

ONS Defends Integrity of Data on Deaths Registered Weekly in England and Wales

I am now satisfied that ONS did not tinker with the mortality data. That’s a relief.

Yesterday I wrote about the latest correspondence with ONS. The latest explanation from Anne suggests we were talking about different sheets. In her own words:


Good afternoon, Dr Schestowitz

Thank you for your response.

I have utilised the previous versions tab of the Deaths Registered weekly set to look through this enquiry.

As I explained in the previous email, the undercount affected death occurrences not registrations. Death registrations use the date of death registrations, whereas occurrences use date of death.

This is a screen shot of sheet 1 (Weekly provisional death registrations in England and Wales) published for week 49. Sheet 2 (weekly provisional death registrations by sex and age in England and Wales) also uses death registrations.

On the previous versions tab this is week 49 when you download the excel spreadsheet published 20th December. I have used an arrow to denote the publishing week at the top of the screenshot.

There is no week 50 dataset due to the festive period, therefore week 51 contains both week 50 and week 51 data.

ONS image 1

This version of Sheet 1 (registrations) was superseded with week 50 and 51 data on 5th January 2023. As you rightly point out there is no change to the registration data for week 49, this is because the undercount did not affect death registrations.

ONS image 2

However, on Sheet 11 which uses death occurrences (date of death) we published 10,565 death occurrences in week 49 on the 20th December with a note explaining the undercount was due to a processing error.

ONS image 3

With the next publication on 5th January, publishing week 50 and 51 data we corrected the undercount and published 12,109 death occurrences for week 49.

ONS image 4

The majority of worksheets within weekly death publication use Registration data, which is why the update in week 51 may not have been overtly visible.

I hope this answers your question and please let me know if I can be of any further assistance.

Kind regards

Anne


“Thank you, Anne,” I said. “That’s a very detailed and satisfactory explanation. I will use it to relay a clarification on what happened and why there’s no reason to doubt the accuracy of this data. PS – the work you do is very important at this time.”

Retrieval statistics: 21 queries taking a total of 0.142 seconds • Please report low bandwidth using the feedback form
Original styles created by Ian Main (all acknowledgements) • PHP scripts and styles later modified by Roy Schestowitz • Help yourself to a GPL'd copy
|— Proudly powered by W o r d P r e s s — based on a heavily-hacked version 1.2.1 (Mingus) installation —|