Introduction About Site Map

XML
RSS 2 Feed RSS 2 Feed
Navigation

Main Page | Blog Index

Archive for the ‘Health’ Category

Smoking Kills. What Else?

New video:

Description:

US, Weekly Cumulative All-Cause Excess Deaths

https://www.usmortality.com

https://www.usmortality.com/deaths/excess-cumulative/united-states

Excess deaths 2022 (Up to December 1st) 242,224

https://www150.statcan.gc.ca/n1/pub/71-607-x/71-607-x2021028-eng.htm

https://www23.statcan.gc.ca/imdb/p2SV.pl?Function=getSurvey&SDDS=3233

Australian Bureau of Statistics

Provisional Mortality Statistics

Reference period, Jan – Sep 2022

144,650 deaths that occurred by 30 September

19,986 (16.0%) more than the historical average.

Deaths attributed to covid, 8,160

October covid deaths, 232

Australia, September 2022

13,675 deaths (doctor certified)

1,814 were coroner referred.
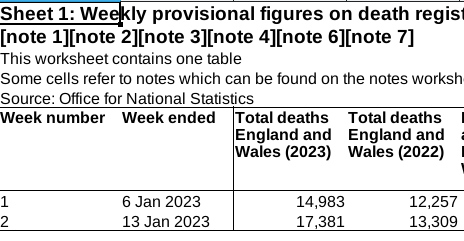
UK, ONS

https://www.ons.gov.uk/peoplepopulationandcommunity/healthandsocialcare/conditionsanddiseases/articles/coronaviruscovid19latestinsights/infections

UK Prevalence

2.61% in England (1 in 40 people)

3.94% in Wales (1 in 25 people)

4.22% in Northern Ireland (1 in 25 people)

3.26% in Scotland (1 in 30 people)

Deaths and excess deaths (W/E week 13th January 2023)

A total of 19,916 deaths were registered in the UK

20.4% above the five-year average.

Covid UK deaths

1,059 deaths involving COVID-19 registered

(up 842 on the week)

Deaths involving COVID-19 accounted for 5.3% of all deaths

UK, Office for Health Improvement

https://www.gov.uk/government/statistics/excess-mortality-in-england-and-english-regions

Excess deaths in all age groups, (0 to 24 years)
UK, Institute and Faculty of Actuaries

https://actuaries.org.uk/news-and-media-releases/news-articles/2023/jan/17-january-23-cmi-says-2022-had-the-worst-second-half-for-mortality-since-2010/

Mortality rates in 2022 compare to 2019 at different ages

2022, mortality, 7.8% higher for ages 20-44

In the UK, the second half of 2022

26,300 excess deaths,

compared to 4,700 in the first half of 2022

Europe, EuroMOMO, Bulletin week 2 2023

https://www.euromomo.eu

Pooled EuroMOMO, all-cause mortalit

Elevated level of excess mortality,

overall and in all age groups.

Data from 25 European countries or subnational regions

Average levels from pre 2020

https://www.health.govt.nz/nz-health-statistics/health-statistics-and-data-sets/mortality-data-and-stats

https://www.stats.govt.nz/topics/births-and-deaths

Year ended September 2021, total of 34,578 deaths

Year ended September 2022, total of 38,052 deaths

Studying the Evidence on Efficacy and Safety at Long Last?

New video:

Description: (for backup; Google censors his videos sometimes)

JCVI makes interim recommendations to government on the COVID-19 vaccination programme for 2023.

https://www.gov.uk/government/news/jcvi-advises-an-autumn-covid-19-vaccine-booster

https://www.gov.uk/government/collections/covid-19-vaccination-programme

Joint Committee on Vaccination and Immunisation (JCVI)

has advised that plans should be made for those at higher risk of severe COVID-19 to be offered a booster vaccination this autumn (2023).

Professor Wei Shen Lim, Chair of COVID-19 vaccination on the JCVI

As the transition continues away from a pandemic emergency response towards pandemic recovery,

In England, the closure of the autumn booster campaign and the first booster offer will be on 12 February 2023.

(basically no more boosters for healthy under 50s)

Similarly, the JCVI is advising that the primary course COVID-19 vaccination should move,

over the course of 2023, towards a more targeted offer

Coronavirus (COVID-19) vaccine

https://www.nhs.uk/conditions/coronavirus-covid-19/coronavirus-vaccination/coronavirus-vaccine/

Everyone aged 5 (on or before 31 August 2022) and over can get a 1st and 2nd dose of the COVID-19 vaccine.

https://www.sst.dk/en/English/Corona-eng/Vaccination-against-COVID-19

we recommend vaccination of people aged 50 years and over as well as selected risk groups.

Regulator funding

https://www.bmj.com/content/377/bmj.o1538

Industry money saturates the globe’s leading regulators.

Latest on ONS and the Mystery of Missing (or Undercounted) Deaths in Week 49 2022

This is the latest (still ongoing):

> Good morning Dr Schestowitz
>
> Apologies, I didn’t note the screenshot in your first email.
>
> For the week you are referencing, we did not publish the numbers of
> death occurrences (date of death) for that week and these were updated
> the following week.
>
> There would have been no changes in any of the tables that use
> registrations data, but you would see the undercount in the occurrences.
>
> May I ask what table you are looking at?
>
> Kind regards
>
> Anne

Hi,

Thanks for the quick reply.

On December 20th the page looked like this:

Over the Christmas period we will not be publishing Deaths registered weekly in England and Wales so the next publication will be available on the 5th of January and shall cover the weeks ending 16th and 23rd of December. Due to a processing issue, there has been an undercount of death occurrences in week ending 9th of December. Due to this the figures for week 49 will now be published in the next weekly mortality publication coming out on the 5th of January.

That was minutes after the 10AM (ish) update.

Despite what it said in the text, the spreadsheet file was updated that morning and included Week 49. Here is a screenshot:

Undercount of deaths

This screenshot was taken on December 20th.

I was expecting that on January 5th this number should be amended, as the figure for Week 49 was incomplete. But in all subsequent updates that number remained the same, so either the missing deaths were added cumulatively to Weeks 50 (onwards) or something went wrong. No “(i) Notice” has been shown since then, so I’m left wondering what actually happened. I need to be sure this data is accurate.

I expressed these concerns publicly about half a dozen times before I learned that Professor Fenon et al had made a formal complaint to the Statistic Regulator. Their complaints is completely unrelated. But it increased my doubts and scepticism about ONS-provided data.

I’ve used your data for a long time. I need to understand why the Week 49 figure (shown in the screenshot above) remained unchanged.
You said: “For the week you are referencing, we did not publish the numbers of death occurrences (date of death) for that week and these were updated the following week.”

If you mean you did not publish Week 49 figures on December 20th, then that is patently untrue and I took a screenshot to prove it. The spreadsheet file was updated that day. It contained the figure for Week 49.

I have more screenshots from around that time and I can provide them to you.

Are we talking about sheet #2 rather than #11?

Regards,

For some background see this prior episode.

Office for National Statistics Responds to My Query About Undercounted Deaths, But Does Not Answer the Question

Earlier today I noted that the Office for National Statistics (ONS) hadn’t replied within the time frame or ‘window’ specified in their automated reply. I therefore prodded ONS again, politely, and within hours I received the following response:

Good morning Dr Schestowitz

Thank you for your email. Apologies for the delay in responding, we have a large volume of enquiries at the moment.

Deaths in the last week of December and the first week of January are impacted by bank holidays where registry offices are closed. These deaths are then usually registered in the following week.

This isn’t an undercount, rather we see a lower number of death registrations on weeks with a bank holiday followed by a larger number of death registrations the week after a bank holiday. So the numbers will stay the same, we just ask people to use caution when comparing trends as they need to be aware of this short-term displacement effect that happens across weeks with bank holidays and the week after.

Kind regards

Anne

Anne

Customer Services Team

Health Analysis and Pandemic Insight (HAPI)

Office for National Statistics | Swyddfa Ystadegau Gwladol | www.ons.gov.uk | @ONS

I quickly responded:

Hi Anne,

Thank you for the reply.

The reply does not address my question however. I did not ask about the last week of December or bank holidays.

My query was about the week ending 9th of December. I took a screenshot of your site: (PNG file)

Over the Christmas period we will not be publishing Deaths registered weekly in England and Wales so the next publication will be available on the 5th of January and shall cover the weeks ending 16th and 23rd of December. Due to a processing issue, there has been an undercount of death occurrences in week ending 9th of December. Due to this the figures for week 49 will now be published in the next weekly mortality publication coming out on the 5th of January.

Undercount of deaths

In your own words, there was a “processing issue”, resulting in “undercount of death occurrences”. It said the figures for week 49 would be “published in the next weekly mortality publication”, but in all subsequent weeks after that the number was the same and not corrected. In other words, the number you gave while stating “undercount of death occurrences” is still an undercount almost 1.5 months after the week in question. This needs to be corrected or clarified, otherwise it is a contraction that lessens quality in your data.

Please can you explain what happened to week 49?

Kind regards,

Let’s see if this time they will actually answer the question rather than address something I did not ask at all.

In Young Adults in the UK Deaths Have Soared by 31%

As per the latest data, which is alarming:

Deaths weeks 2023

How does that compare to 2019? Let’s check the official records. The numbers below are the total deaths (not a sub-sample).

Babies:

2019: 50. 2023: 55 (10% increase).

Kids (ages 1-14):

2019: 20. 2023: 24 (20% increase).

Adults (ages 15-44):

2019: 280. 2023: 365 (30.57% increase).

Ages 45-64):

2019: 1419. 2023: 1798 (26.7% increase).

Ages 65-74):

2019: 2179. 2023: 2609 (19.7% increase).

Ages 75-84):

2019: 3590. 2023: 5094 (42% increase).

Age 85+:

2019: 5071. 2023: 7436 (46% increase).

So deaths are off the chart. And young people are not exempted.

National Crisis and Catastrophic ‘New Normal’: UK Deaths Soaring Even More While the Government and Media Stay Silent

ONS data week 2 2013

ONS data week 2 2013 - image

IMAGINE the media not talking about this….

With over 17.3k deaths last week (in Wales and Eng alone; Scotland and Northern Ireland probably have well over a thousand more), as per the data published 20 minutes ago, the public deserves an explanation. These deaths are off the chart! Here it is compared (pre-pandemic and present time, with media trying to convince us it’s “over” and “back to normal”).

17,381 deaths

7 Days Have Passed, Office for National Statistics Has Not Replied to a Very Simple Query From Me (About ‘Missing’ Deaths Data)

Over a month ago the Office for National Statistics (ONS) had a glaring omission. It never bothered to correct it (more than a month had already passed!), so a week ago I made this polite inquiry.

This is what I received:

Thank you for your email.

Due to the high volume of enquiries we aim to respond to your enquiry within 5 working days.

This inbox will be actively managed Monday to Thursday 0830 – 1630 and Friday 0830 – 1530.

We appreciate your patience.

Kind regards

Health Analysis and Life Event Customer Service Team.

Office for National Statistics

Any further attempts to contact them give me this generic (not personalised) response:

Thank you for your email.

This inbox is actively managed Monday to Thursday 0830 – 1600 and Friday 0830 – 1500.

Due to the high volume of enquiries we aim to respond to your email within 10 working days.

We appreciate your patience.

HAPI Customer Services Team

Health Analysis and Pandemic Insight

Office for National Statistics | Swyddfa Ystadegau Gwladol

Tel. 01329 444 110 | www.ons.gov.uk | @ONS

So now it is 10, not 5? That’s not even consistent. Anyway, maybe by next week?

Sigh.

So when are they actually going to respond to my query? It’s the taxpayers that fund them to do this simple job.

Retrieval statistics: 21 queries taking a total of 0.149 seconds • Please report low bandwidth using the feedback form
Original styles created by Ian Main (all acknowledgements) • PHP scripts and styles later modified by Roy Schestowitz • Help yourself to a GPL'd copy
|— Proudly powered by W o r d P r e s s — based on a heavily-hacked version 1.2.1 (Mingus) installation —|