Introduction About Site Map

XML
RSS 2 Feed RSS 2 Feed
Navigation

Main Page | Blog Index

Archive for the ‘Health’ Category

Week 51 (Christmas) Deaths by Age Group in England and Wales: 2019 and 2022 Compared, According to ONS (the Government’s Official) Figures

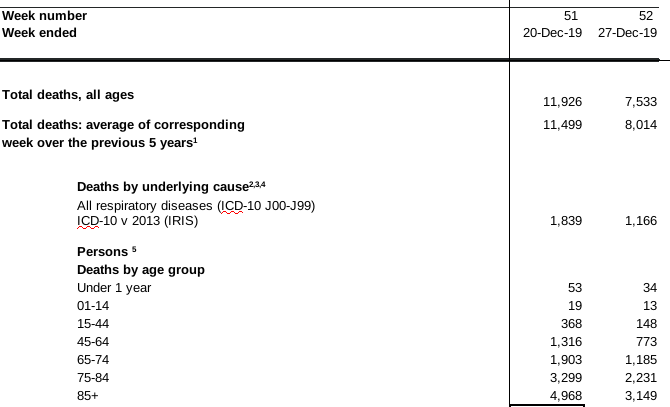
2019:

Week 51 deaths in 2019

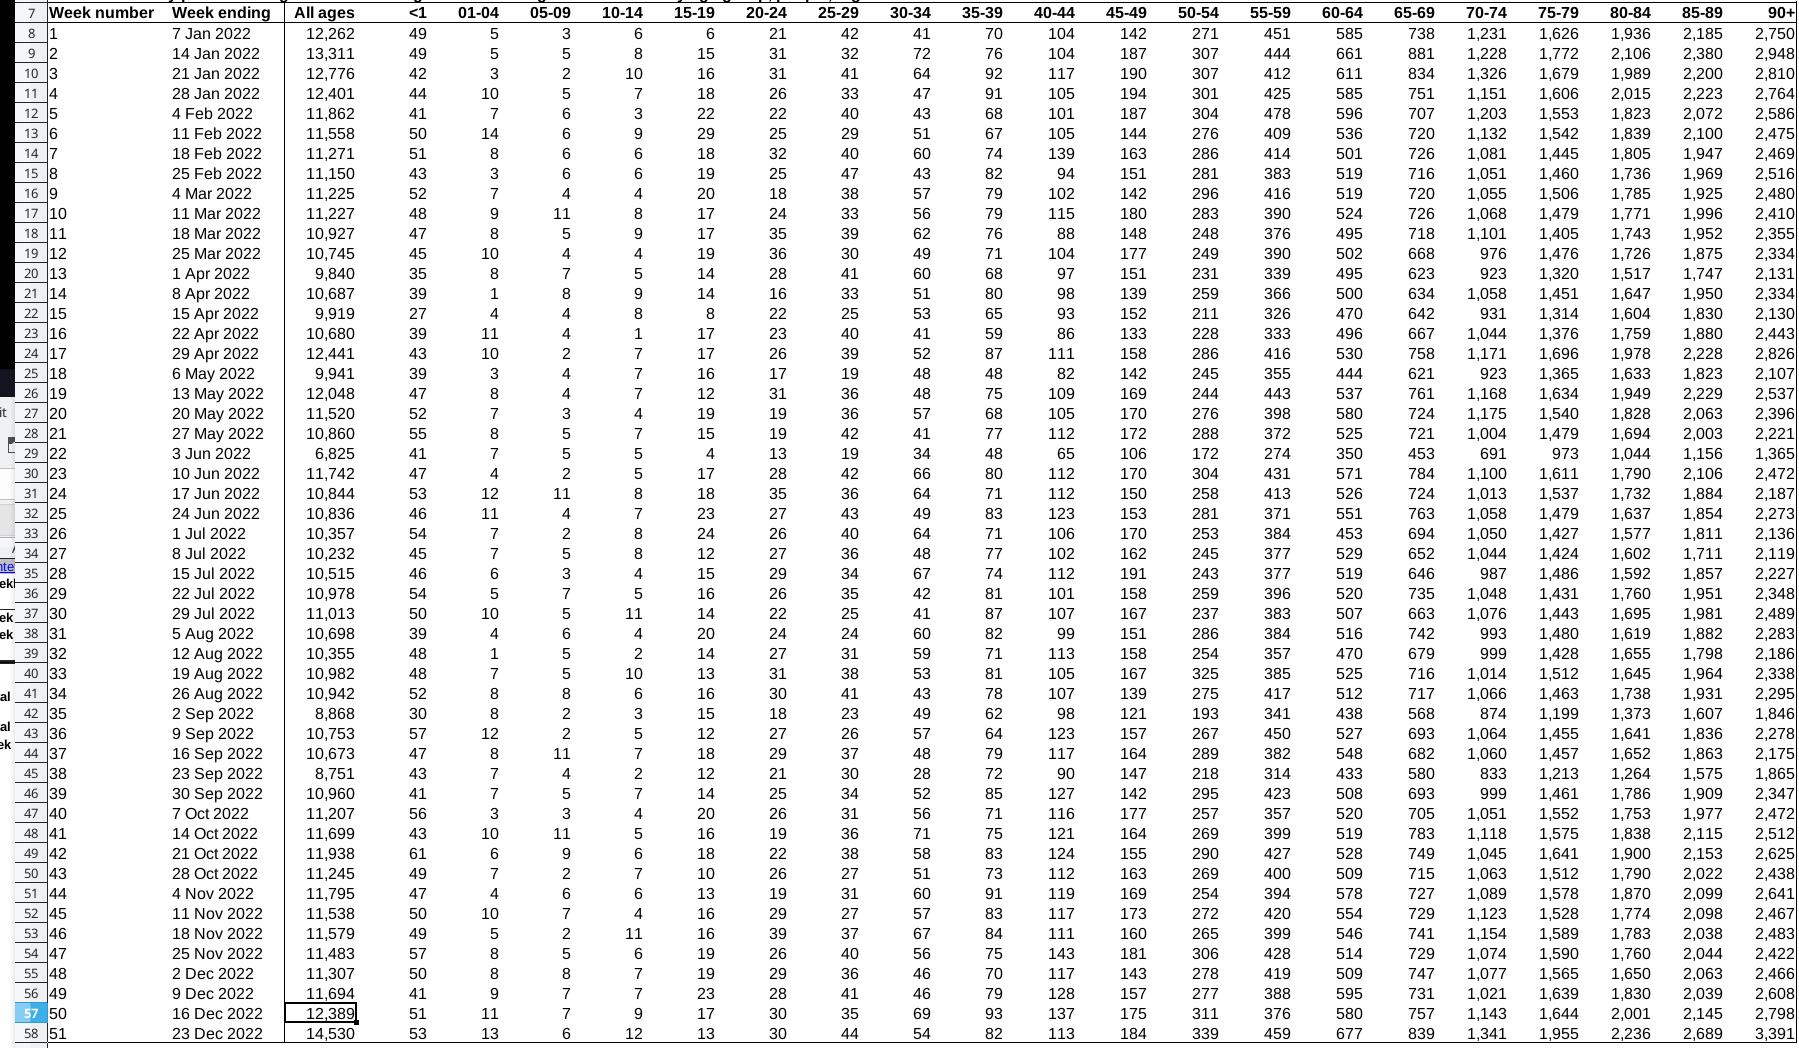
2022:

Deaths in 2022

Kids under 1

2019: 53 deaths
2023: 53 deaths

Kids aged 1-14

2019: 19 deaths
2023: 31 deaths

People aged 15-44

2019: 368 deaths
2023: 336 deaths

People aged 45-64

2019: 1,316 deaths
2023: 1,659 deaths

People aged 65-74

2019: 1,903 deaths
2023: 2,180 deaths

People aged 75-84

2019: 3,299 deaths
2023: 4,191 deaths

People aged over 85

2019: 4,968 deaths
2023: 6,080 deaths

So deaths grew by a lot, but older people were the main component of this increase.

This Might Help Explain Massive Increase in UK Mortality in Recent Years

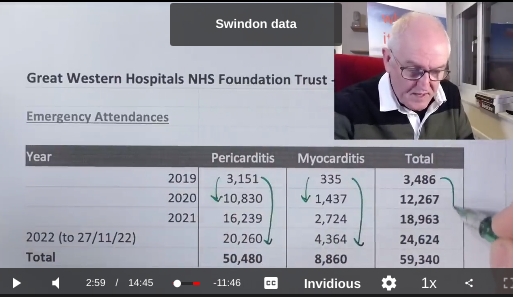
Via this new video:

2022 data from Swindon

Myocarditis

So there seems to be a ‘pandemic of heart conditions’ now.

Yesterday: ONS: England and Wales Deaths in Week 51 (Xmas) Rose From 11.5K Before Pandemic to 14.5K in 2022 (26.4% Increase)

Total Patients With COVID-19 in England Similar This Past December to December 2021

Date, people hospitalised with COVID-19, running sum in 2021:

31-12-2021 1,781 544,469
30-12-2021 2,114 542,688
29-12-2021 2,370 540,574
28-12-2021 2,082 538,204
27-12-2021 1,751 536,122
26-12-2021 1,374 534,371
25-12-2021 1,281 532,997
24-12-2021 1,020 531,716
23-12-2021 1,252 530,696
22-12-2021 1,246 529,444
21-12-2021 1,098 528,198
20-12-2021 1,061 527,100
19-12-2021 926 526,039
18-12-2021 735 525,113
17-12-2021 743 524,378
16-12-2021 777 523,635
15-12-2021 805 522,858
14-12-2021 815 522,053
13-12-2021 794 521,238
12-12-2021 772 520,444
11-12-2021 696 519,672
10-12-2021 707 518,976
09-12-2021 799 518,269
08-12-2021 754 517,470
07-12-2021 799 516,716
06-12-2021 736 515,917
05-12-2021 728 515,181
04-12-2021 635 514,453
03-12-2021 624 513,818
02-12-2021 719 513,194
01-12-2021 698 512,475

Date, people hospitalised with COVID-19, running sum in 2022:

31-12-2022 723 938,730
30-12-2022 940 938,007
29-12-2022 1,225 937,067
28-12-2022 1,245 935,842
27-12-2022 1,134 934,597
26-12-2022 988 933,463
25-12-2022 844 932,475
24-12-2022 780 931,631
23-12-2022 899 930,851
22-12-2022 1,236 929,952
21-12-2022 1,293 928,716
20-12-2022 1,376 927,423
19-12-2022 1,296 926,047
18-12-2022 1,176 924,751
17-12-2022 799 923,575
16-12-2022 834 922,776
15-12-2022 1,064 921,942
14-12-2022 963 920,878
13-12-2022 1,026 919,915
12-12-2022 965 918,889
11-12-2022 872 917,924
10-12-2022 582 917,052
09-12-2022 607 916,470
08-12-2022 697 915,863
07-12-2022 748 915,166
06-12-2022 779 914,418
05-12-2022 724 913,639
04-12-2022 589 912,915
03-12-2022 498 912,326
02-12-2022 468 911,828
01-12-2022 583 911,360

The official government line (or propaganda) is that not many of them are hospitalised because of COVID-19 but merely with it. But in 2021 that’s just as true as it is in 2022.

The COVID-19 Statistics Are… (UPDATED)

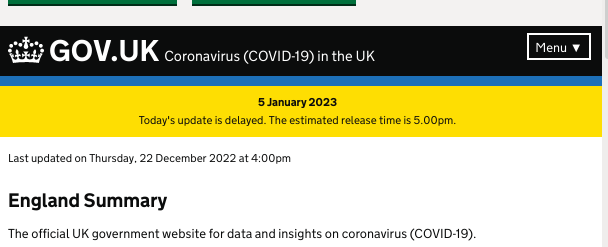
Delayed again. After several weeks of nothing… still nothing.

COVID delay

“Today’s update is delayed. The estimated release time is 5.00pm.”

The deaths are very high despite incomplete data.

Well, SKY ‘NEWS’ said one hour ago that there’s a fall in flu and COVID cases. But deaths are up sharply across the UK. The mainstream media seems to be actively lying to people in order to impose optimism on the peasantry.

The risk of death remains high, not just for old people.

UPDATE

So the data is now belatedly out… but it’s missing data:

Missing data again

At this stage it’s no longer possible to even trust our government’s count of how many people are dying.

ONS: England and Wales Deaths in Week 51 (Xmas) Rose From 11.5K Before Pandemic to 14.5K in 2022 (26.4% Increase)

Their numbers are not reliable anymore, but here’s the data for week 51 (two weeks ago):

Xmas 2022 deaths

Compared to pre-pandemic levels:

Cmas deaths in 2019

Xmas deaths, average for 2014-19: 11.5k
For 2022: 14.5k

But don’t worry, that’s just about 3,000 more dead people than before…. in one week! And nobody will notice, merry Xmas everyone!!

That’s 26.4% increase in deaths, but they tell us to quit worrying about the COVID-19 pandemic, side effects of vaccines (dare to suggest any exist and they’ll call you “antivaxer”), and the NHS crisis in general.

Data Contradiction Means Office for National Statistics (ONS) Began Shamelessly Lying About Number of Dead People

Weeks ago it said:

Over the Christmas period we will not be publishing Deaths registered weekly in England and Wales so the next publication will be available on the 5th of January and shall cover the weeks ending 16th and 23rd of December. Due to a processing issue, there has been an undercount of death occurrences in week ending 9th of December. Due to this the figures for week 49 will now be published in the next weekly mortality publication coming out on the 5th of January.

And this:

Undercount of deaths

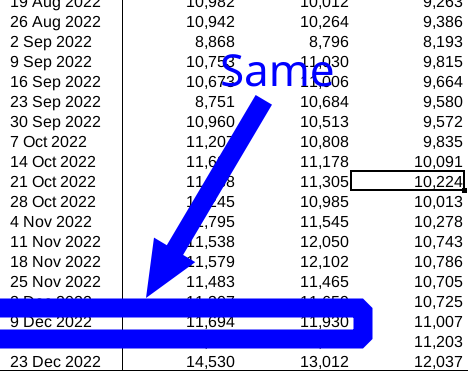
Only a few minutes ago it released the numbers again. But they are the same!!!!!!!

Here:

Same undercount

In order to potentially save face for Rishi (unelected PM who pretends to be a GP now in some media photo ops) ONS delayed and delayed data. NO RELIABLE DATA ON DEATHS SINCE DECEMBER 2ND!!! And they did not bother to correct what they already admitted to be an “undercount”.

A new year’s resolution? Hide the dead? Undercount them?

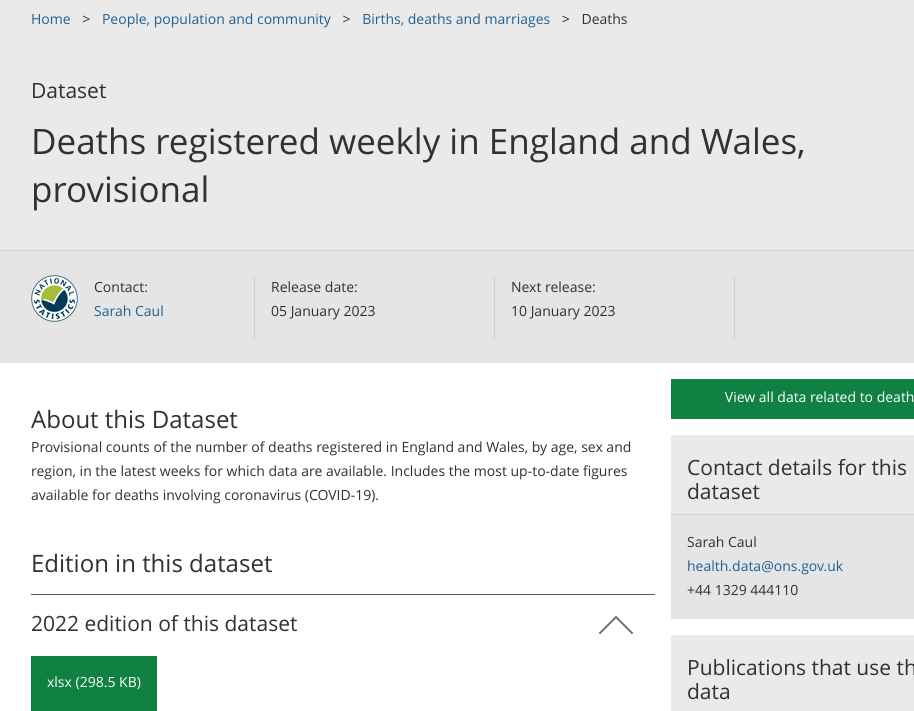
There is no notice in the site saying that they are still undercounting or that there is missing data. Sarah Caul’s update looks like this now:

Sarah Caul no notice

Sarah, does it take more than 3 weeks to ‘find’ those ‘missing’ death certificates? What on Earth is going on here? ‘Traffic-shaping’ of numbers? This is not acceptable. Taxpayers are paying to be informed; ONS says it’s not subjected to political pressure, but maybe that’s tacitly changing.

COVIDiots: Too Confident

The risk of COVID-19 also varied by the number of COVID-19 vaccine doses previously received. The higher the number of vaccines previously received, the higher the risk of covid infection.

Download free high-res PDFs of the posters, download free copies of my two text books. Any donations using this link help the work of campbell teaching.

https://drjohncampbell.co.uk/

Order a hard copy Physiology book in the UK,

https://www.ebay.co.uk/itm/154973392319?mkcid=16&mkevt=1&mkrid=711-127632-2357-0&ssspo=K6raxMZrQnm&sssrc=2349624&ssuid=K6raxMZrQnm&var=&widget_ver=artemis&media=MORE

Vaccine doses versus risk of covid during the 3-month study period

One dose, 1.7 times more likely to test positive for covid

Two doses, 2.63 times more likely to test positive for covid

Three doses, 3.1 times more likely to test positive for covid

More than three doses, 3.8 times more likely to test positive for covid

So compared to the unvaccinated

1, x 1.7

2, x 2.36

3, x 3.1

4, x 3.38

P = 0.001 means 999 out of 1,000 likely to be a genuine result

That 99.9% likely to be a genuine result

Effectiveness of the Coronavirus Disease 2019 (COVID-19) Bivalent Vaccine

https://www.medrxiv.org/content/10.1101/2022.12.17.22283625v1.full

In 2020

(published in 2021)

Evidence that vaccines prevented covid infection

https://www.medrxiv.org/content/10.1101/2021.06.02.21258231v1

This was when the human population had just encountered the novel Severe Acute Respiratory Syndrome Coronavirus 2 (SARS-CoV-2) virus

Things Have Changed (Dylan)

Bivalent antigens

Original vaccine and BA.4/BA.5 lineages of Omicron.

(Approved without demonstration of effectiveness in human clinical studies)

(Approved without demonstration of safety in human clinical studies)

Background

To evaluate whether a bivalent COVID-19 vaccine protects against COVID-19.

Methods

Employees of Cleveland Clinic, n = 51,011

Cumulative incidence of COVID-19 was examined over the following weeks.

Protection provided by recent and prior vaccination was evaluated

First bivalents given, 12 September 2022

Three-month study

Results

Among 51,011 employees,

20,689 (41%) had had a previous documented episode of COVID-19,

42,064 (83%) had received at least two doses of a vaccine.

10,804 (21%) were bivalent vaccine boosted

COVID-19 occurred in 2,452 (5%) during the study.

(Pfizer 89%, Moderna 11%)

Risk of COVID-19 increased with time since the most recent prior COVID-19 episode

Risk of COVID-19 increased with the number of vaccine doses previously received.

Note, this is based on large numbers

Doses, 0 = 6,419 (12.6%)

Doses, 1 = 2,528 (5%)

Doses, 2 = 14,810 (45.9%)

Doses, 3 = 23,396 (45.9%)

Doses 4, 3,757 (7.4%)

Doses 5, 85 (less than1%)

Doses 6, 16 (less than 1%)

The bivalent vaccinated state

Was independently associated with lower risk of COVID-19 (HR, 0.70)

(over the 3 months of the study)

Leading to an estimated vaccine effectiveness (VE) of 30%

CDCs latest variant data

https://covid.cdc.gov/covid-data-tracker/#variant-proportions

Things Have Changed (Dylan)

Retrieval statistics: 21 queries taking a total of 0.153 seconds • Please report low bandwidth using the feedback form
Original styles created by Ian Main (all acknowledgements) • PHP scripts and styles later modified by Roy Schestowitz • Help yourself to a GPL'd copy
|— Proudly powered by W o r d P r e s s — based on a heavily-hacked version 1.2.1 (Mingus) installation —|