Introduction About Site Map

XML
RSS 2 Feed RSS 2 Feed
Navigation

Main Page | Blog Index

Archive for the ‘Science’ Category

14,024 Deaths in the UK During Springtime, British Media Silent (Despite the Alarming Data)

New: Excess deaths in UK rise

Description, in case Google takes down his videos again:

Excess deaths, dramatic increase, week ending 21 April 2023

www.ons.gov.uk/peoplepopulationandcommunity/births…

The number of deaths registered in the UK in the week ending 21 April 2023

(Week 16)

Was 14,024

22.1% above the five-year average

2,540 excess deaths,

of these deaths, 615 involved COVID-19

England and Wales

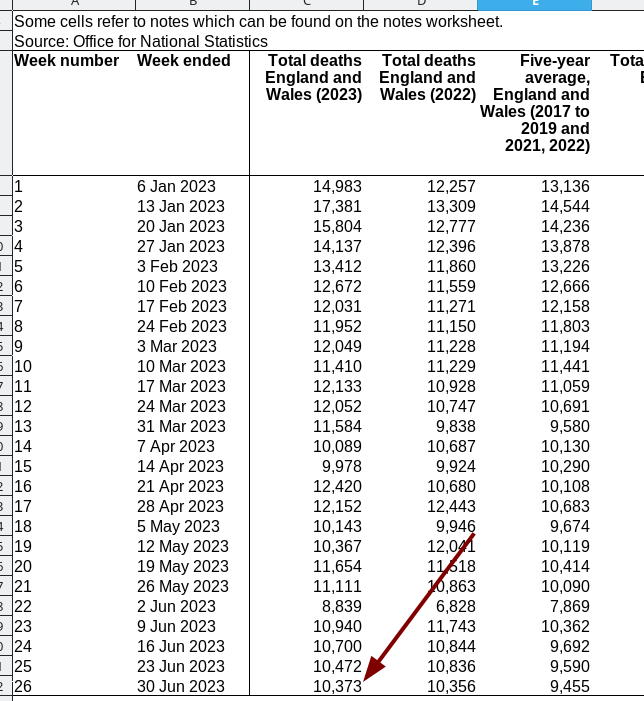
Week 16, 12,420 deaths were registered in England and Wales

538 of these deaths mentioned novel coronavirus (4.3% of all deaths)

Of the 538 deaths involving COVID-19, 66.5% (358 deaths) had this recorded as the underlying cause of death

The number of deaths was above the five-year average

Private homes (29.0% above, 771 excess deaths)

Hospitals (20.2% above, 924 excess deaths)

Care homes (25.3% above, 525 excess deaths)

Other settings (11.7% above, 92 excess deaths)

Could Bradford Hill criteria help?

The larger the association, the more likely that it is causal.

Consistent findings observed by different persons in different places

Lack of alternative explanations

The effect has to occur after the cause

Greater exposure should generally lead to greater incidence of the effect.

A plausible mechanism between cause and effect is helpful

Coherence between epidemiological and laboratory findings increases the likelihood of an effect.

Occasionally it is possible to appeal to experimental evidence

Analogies or similarities between the observed association and any other associations.

Sometimes, reversibility

COVID-19 Crisis Not Over, UK Deaths About 21% Higher Than Before the Pandemic

I CHECKED about 1.5 hours ago to see if the 10 May 2023 ONS numbers were already online. They were indeed, maybe around 9:30AM.

Deaths in week 17 in 2023

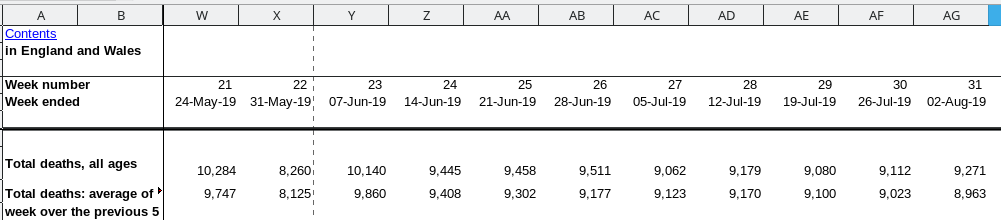
What does the latest data tell us? Compare 2019 deaths count:

Deaths in week 17 in 2019

Now watch this year:

The week 17 latest data

Focus on week 17, the latest on record. From 10,059 deaths in 2019 it rose to about 12.2k in the same week of this year, yet WHO tells us pandemic stuff matters no more and it’s time to get back to “normal”. Don’t listen to WHO. Rely on data, not bureaucrats and politicians who masquerade as health experts.

Pandemic ‘New Normal’: Sharp Increase in Deaths Across All Age Groups

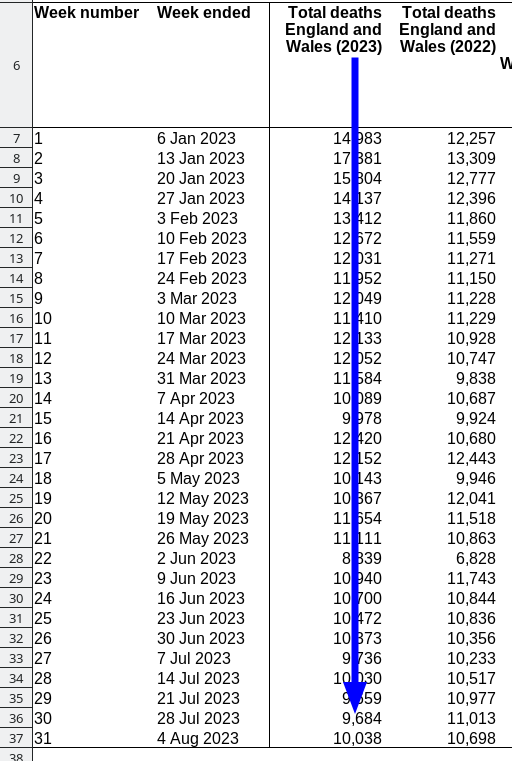
England and Wales death totals by week:

2019 deaths: England and Wales death totals by week

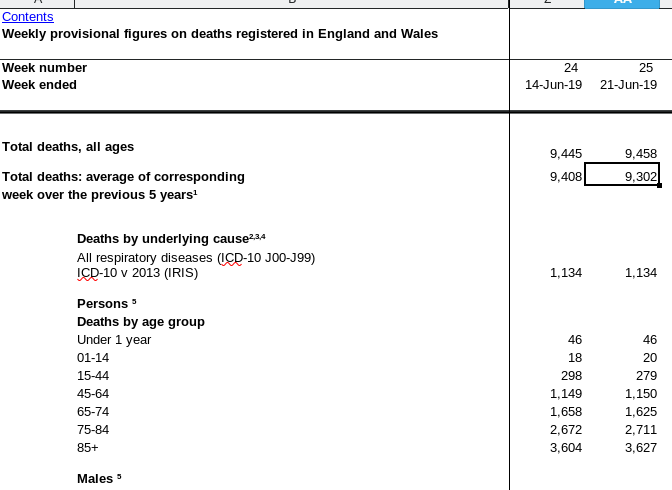
Further to what I published on Wednesday, here’s a breakdown of increase in deaths by age group, debunking the notion that it is impacting only very old people.

The number on the left is the total deaths for week 16 (latest on record) in 2019, compared to the same week in 2023 (shown on the right below), i.e. last month:

For ages 15-45, 321 compared to 251: 28% increase in fatalities
For ages 45-64, 1478 compared to 1100: 34.4% increase in fatalities
For ages 65-74, 1878 compared to 1446: 30% increase in fatalities

Seems like a national health crisis, but the media hardly talks about it, so let’s pretend it’s not happening.

Week 16 England and Wales Deaths in 2019: 9,025. Week 16 England and Wales Deaths in 2023: 12,420. Increase of 38%.

2019:

2019 deaths week 16

And now:

Week 16 2023 deaths

COVID-19 isn’t over. It never was over.

Deaths in England and Wales This Spring Vastly Higher (21% Higher) Than in Prior — Including COVID-19 — Years

I HAVE just checked again and new numbers, for week 13 at least, came out this morning, 5 days after the last time. The numbers are astonishing as they show 2,000+ more deaths than the 5-year average (including pandemic years).

So for a single week, week 13, we’ve leapt from 9,580 to to 11,584 deaths (+2,004).

2023 week 13 ONS deaths

Compared to 2019:

2019 and average week 13

New Data Out From ONS (Week 12): Number of Deaths in England and Wales 16% Higher Than Before the Pandemic

Some new numbers this morning*.

2019***: 10,402 deaths
2014-19 average***: 10,456 deaths
2022**: 10,747 deaths
2023**: 12,052 deaths

(12052-10402)/10402*100=15.86.

_____
* As per 9:40 AM (earlier than 10, the usual time). Was supposed to be out on Tuesday, but this time it got delayed till 13 April 2023 (due to Easter/Bank Holiday).

ONS new week 12

** From ONS (above).

National deaths week 12

*** From ONS (historic)

National deaths week 12 in 2019

COVID-19 Won, We Lost. Why Doesn’t the Media Admit This?

Video download link | md5sum 0728ff8efe7b4350ffebfe6c23131bb0
COVID-19 Remains Untackled
Creative Commons Attribution-No Derivative Works 4.0

I‘ve just published some hard data to show how deaths have soared this year, probably in relation to the neglect of COVID-19 response. Institutions and media compel us to think that COVID-19 is a “thing of the past” or old news while publicly-available data shows alarming numbers, including total mortality across all age groups (it’s up sharply).

Media gaslighting won’t be the solution to all this. We need proper research and real, hard answers.

Retrieval statistics: 21 queries taking a total of 0.091 seconds • Please report low bandwidth using the feedback form
Original styles created by Ian Main (all acknowledgements) • PHP scripts and styles later modified by Roy Schestowitz • Help yourself to a GPL'd copy
|— Proudly powered by W o r d P r e s s — based on a heavily-hacked version 1.2.1 (Mingus) installation —|