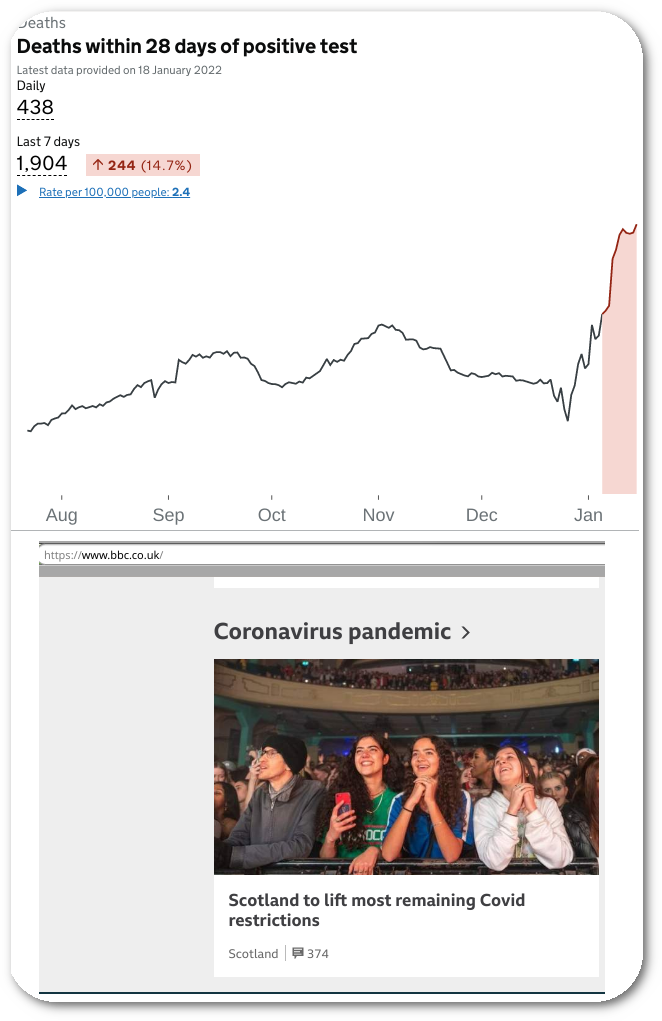
We’re at a similar point now to December 17th of last winter while the government — in its latest face-saving move — underplays the severity and urgency of the latest variants:
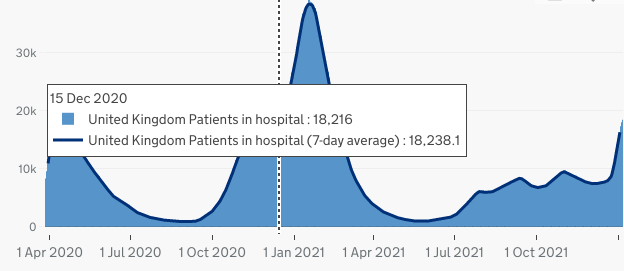
You can see January 2022 on the far right (above). First few days shown.
As per the official figures*:
06-01-2022	18,454
05-01-2022	18,015
04-01-2022	17,311
03-01-2022	16,325
02-01-2022	15,140
01-01-2022	14,508
31-12-2021	14,187
30-12-2021	13,170
29-12-2021	11,985
28-12-2021	10,942
27-12-2021	9,788
26-12-2021	8,770
Compare to last winter:
18-12-2020	19,117
17-12-2020	18,970
16-12-2020	18,671
15-12-2020	18,216
14-12-2020	18,246
13-12-2020	17,538
12-12-2020	16,909
_______
* Daily count of confirmed COVID-19 patients in hospital at 8am, and 7-day rolling average. Data from England, Northern Ireland, Wales and Scotland may not be directly comparable as data about COVID-19 patients in hospitals are collected differently. Data are not reported by each nation every day. The UK figure is the sum of the 4 nations’ figures and can only be calculated when all nations’ data are available.
Update: Belatedly, NHS just caught up with the missing dates (about an hour ago, adding about 3 missing days). Here are the latest numbers:
10-01-2022	19,828
09-01-2022	19,056
08-01-2022	18,619
07-01-2022	18,697
06-01-2022	18,527
05-01-2022	18,064
04-01-2022	17,345
03-01-2022	16,356
02-01-2022	15,167
01-01-2022	14,533
31-12-2021	14,207
30-12-2021	13,184
29-12-2021	11,998
28-12-2021	10,952
27-12-2021	9,795
26-12-2021	8,776
So in two weeks or in 15 days, the UK’s COVID-19 hospital occupancy increased from 8,776 patients to 19,828 patients.


 Filed under:

 s long as actual facts still matter, I won’t