NHS Data Shows That UK ‘Freedom Day’, a PR Stunt of UK Conservatives, Was a Costly Mistake
 Filed under:
 Related: Mass infection is not an option: we must do more to protect our young
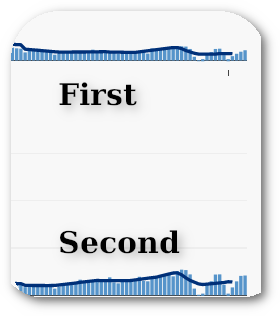
From the official NHS data: (annotated for improved clarity)


|
|


Navigation |
Related: Mass infection is not an option: we must do more to protect our young
From the official NHS data: (annotated for improved clarity)
Quick and effective way to respond to so-called ‘COVID deniers’ (who think that nothing exceptional happened).
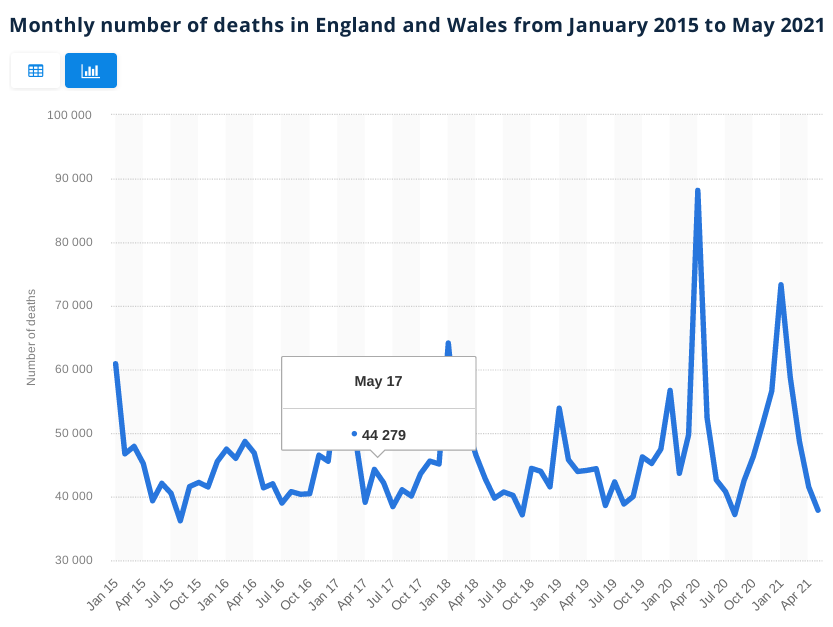
The numbers:
May 21 37,864
Apr 21 41,513
Mar 21 48,624
Feb 21 58,767
Jan 21 73,315
Dec 20 56,614
Nov 20 51,330
Oct 20 46,296
Sep 20 42,500
Aug 20 37,187
Jul 20 40,780
Jun 20 42,624
May 20 52,374
Imagine how worse if would have been if no lock-downs were imposed.
By week:
Week	        Weekly 	Average
19 Nov 21	12,103	10,350
12 Nov 21	12,050	10,331
5 Nov 21	11,550	9,891
29 Oct 21	10,987	9,759
22 Oct 21	11,308	9,865
15 Oct 21	11,177	9,811
8 Oct 21	10,807	9,555
1 Oct 21	10,510	9,377
24 Sep 21	10,684	9,264
17 Sep 21	11,009	9,306
10 Sep 21	11,035	9,182
3 Sep 21	8,797	8,241
27 Aug 21	10,268	9,157
20 Aug 21	10,013	9,085
13 Aug 21	10,372	9,102
6 Aug 21	10,187	9,036
30 Jul 21	10,135	9,052
23 Jul 21	9,744	9,093
16 Jul 21	9,697	9,250
9 Jul 21	9,752	9,183
2 Jul 21	8,808	9,293
25 Jun 21	8,690	9,404
18 Jun 21	9,459	9,417
11 Jun 21	10,204	9,977
4 Jun 21	7,778	8,171
27 May 21	9,628	9,940
21 May 21	9,860	10,188
14 May 21	10,164	9,576
7 May 21	7,986	9,941
30 Apr 21	9,692	10,458
23 Apr 21	9,941	10,497
16 Apr 21	10,428	10,520
9 Apr 21	9,098	10,305
2 Apr 21	8,201	10,130
26 Mar 21	10,045	10,573
19 Mar 21	10,311	11,205
12 Mar 21	10,987	11,498
5 Mar 21	11,592	11,183
26 Feb 21	12,614	11,548
19 Feb 21	13,809	11,627
12 Feb 21	15,354	11,925
5 Feb 21	17,192	12,206
29 Jan 21	18,448	12,760
22 Jan 21	18,676	13,216
15 Jan 21	18,042	13,822
8 Jan 21	17,751	12,175
1 Jan 21	10,069	7,954
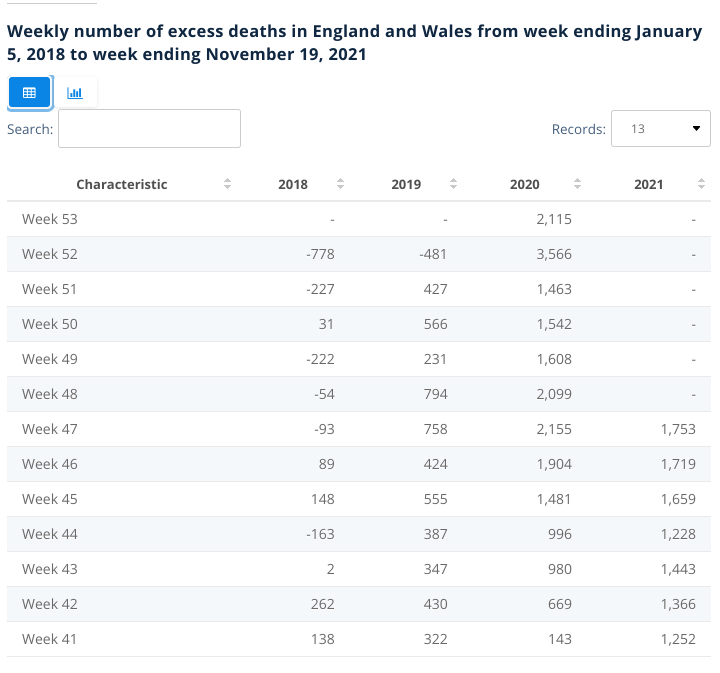
Pre-pandemic, excess deaths, per week:
Week	2018	2019	2020	2021
Week 47	-93	758	2,155	1,753
Week 46	89	424	1,904	1,719
Week 45	148	555	1,481	1,659
Week 44	-163	387	996	1,228
Week 43	2	347	980	1,443
Week 42	262	430	669	1,366
Week 41	138	322	143	1,252
Although the government barely releases any new hospitalisation-related numbers (almost none since Christmas), some have put the numbers together and show that in January 2nd 2021 there were 2829 hospitalisations in England compared to 1971 in January 2nd 2022, i.e. three days ago.

Hospitalisations related to COVID-19 are soaring again.
Source: Vaccine_surveillance_report week_49

Total deaths in the period studied/surveyed: 3310
Total deaths of people who did not receive a COVID-19 vaccine: 700 (21.11% of the total)
The footnote which puts this into better context: “In the context of very high vaccine coverage in the population, even with a highly effective vaccine, it is expected that a large proportion of cases, hospitalisations and deaths would occur in vaccinated individuals, simply because a larger proportion of the population are vaccinated than unvaccinated and no vaccine is 100% effective. This is especially true because vaccination has been prioritised in individuals who are more susceptible or more at risk of severe disease. Individuals in risk groups may also be more at risk of hospitalisation or death due to non-COVID-19 causes, and thus may be hospitalised or die with COVID-19 rather than because of COVID-19.”

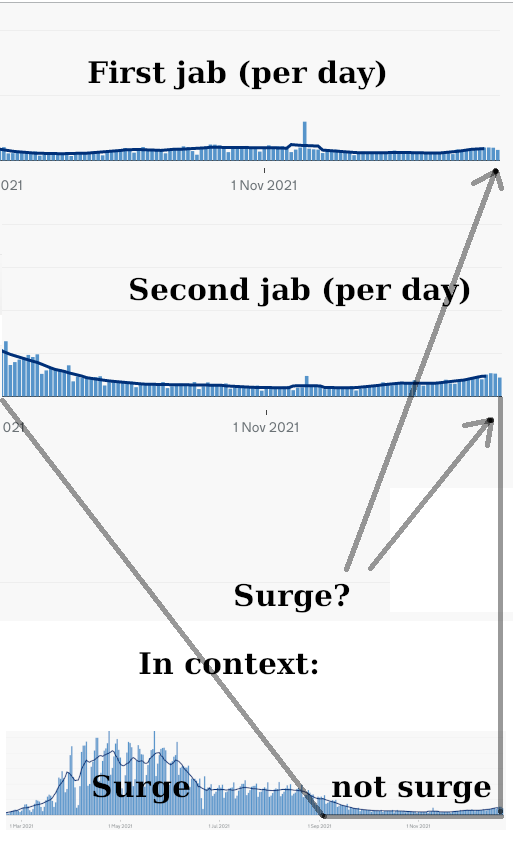
Update: Today is the last day of the year and here’s what the data (latest) looks like today:
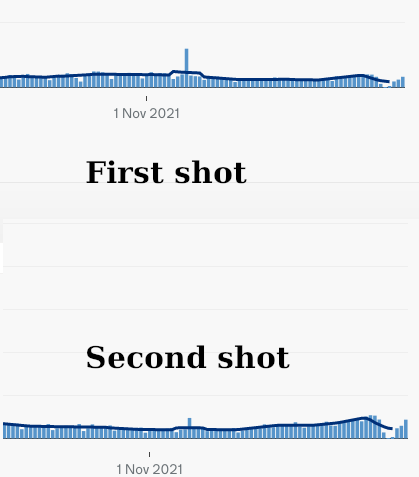
Some “surge”, eh?
Update #2 (January 7th): 12 days have passed. Let’s revisit the data from the official source.
Is this a surge?
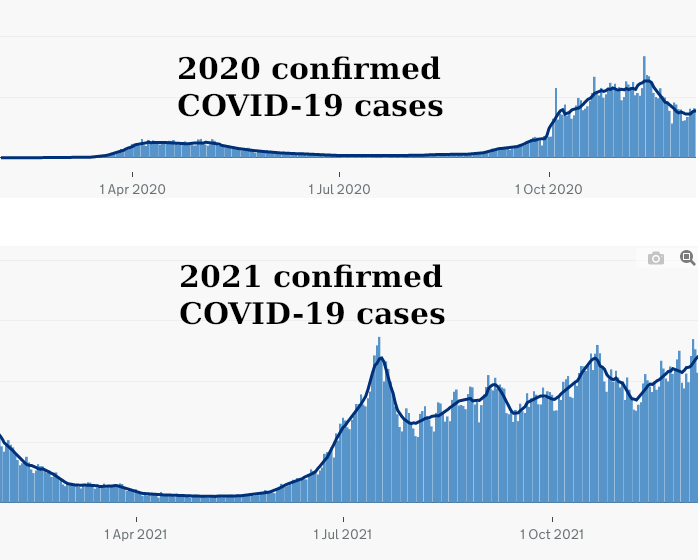
2022 will surely be even worse, seeing that yesterday we had an all-time high of nearly 80,000 confirmed cases in just one day
See: Mass infection is not an option: we must do more to protect our young
Source data: NHS (official)
Data source: NHS
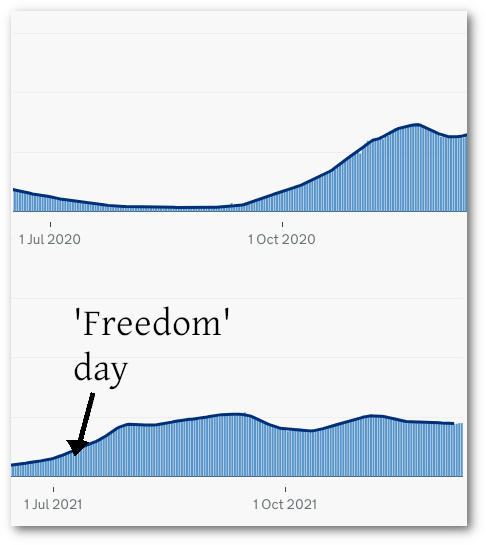
My interpretation: The vaccines did lower the numbers, but not by much. Number patients in mechanical ventilation beds right now: 900+. Same time last year (before AZ mass vaccination): 1,200+.
It’s an improvement, but not a massive improvement. Considering we now know a lot more about how to treat COVID-19 patients.
I keep watching the excess deaths/mortality figures, which are summarised in a weekly report here (updated every Thursday).
It’s not about bashing anything, it’s about analysing the data to understand the science and reject dogmatic business marketing.
Retrieval statistics: 21 queries taking a total of 0.088 seconds • Please report low bandwidth using the feedback form
Original styles created by Ian Main (all acknowledgements) • PHP scripts and styles later modified by Roy Schestowitz • Help yourself to a GPL'd copy
|— Proudly powered by W o r d P r e s s — based on a heavily-hacked version 1.2.1 (Mingus) installation —|