Introduction About Site Map

XML
RSS 2 Feed RSS 2 Feed
Navigation

Main Page | Blog Index

Archive for the ‘Health’ Category

In the United States, Winter Deaths Increased 28% Between 2016 and This Year (But President Biden Insists Pandemic is Over)

CDC is authoritative, but it is curious that it doesn’t wish to give access to data from pre-COVID-19 years (I needed to use the Wayback Machine for that).

Local copy of the data (ODF): VSRR – State and National Provisional Counts for Live Births, Deaths, and Infant Deaths 2016-17 (via Wayback Machine)

January 2016: 246,000 deaths
January 2016: 230,000 deaths
March 2016: 244,000 deaths
Total deaths: 720,000

January 2017: 261,000 deaths
February 2017: 232,000 deaths
March 2017: 249,000 deaths
Total deaths: 742,000

Latest data:

January 2022: 368,000 deaths
February 2022: 288,000 deaths
March 2022: 266,000 deaths (latest month in public record)
Total deaths: 922,000 (28% more than in 2016 and 24% more than 2017)

Also see: CDC Data: US Deaths About 25% Higher This Winter Than Last Winter Before COVID-19 (Updated)

Many Young People Are Dying (a Lot More Than Before)

Published 50 minutes ago:

Video description (in case they take down the video/channel):

Pfizer expects to hike U.S. COVID vaccine price to $110-$130 per dose

https://www.reuters.com/business/healthcare-pharmaceuticals/pfizer-expects-price-covid-vaccine-110-130-per-dose-2022-10-20/

Pfizer executive Angela Lukin

Pfizer Inc expects to roughly quadruple vaccine price,

to about $110 to $130 per dose,

after the United States government’s current purchase program expires,

U.S. government currently pays around $30 per dose to Pfizer and German partner BioNTech

Pfizer

Expects the COVID-19 market to be about the size of the flu shot market

Tim Gough, 55, Radio Suffolk

https://www.telegraph.co.uk/news/2022/10/24/radio-dj-dies-halfway-hosting-breakfast-show/

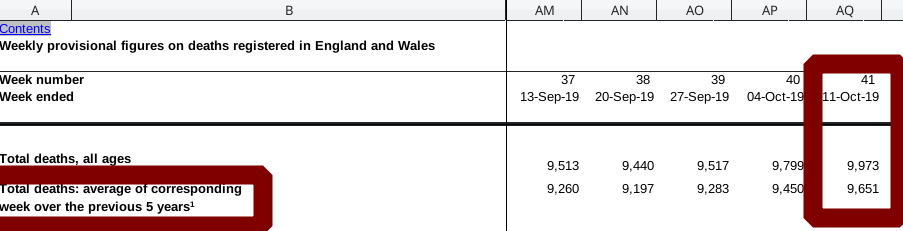
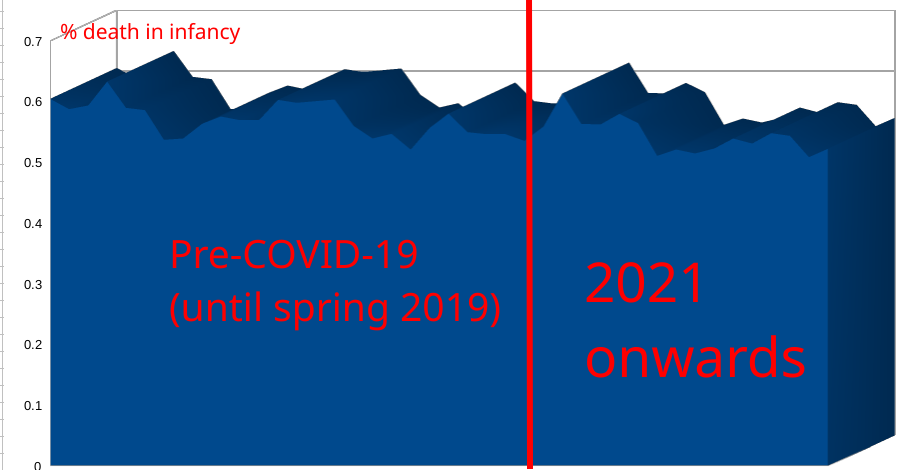
Excess deaths in the young

https://app.powerbi.com/view?r=eyJrIjoiYmUwNmFhMjYtNGZhYS00NDk2LWFlMTAtOTg0OGNhNmFiNGM0IiwidCI6ImVlNGUxNDk5LTRhMzUtNGIyZS1hZDQ3LTVmM2NmOWRlODY2NiIsImMiOjh9
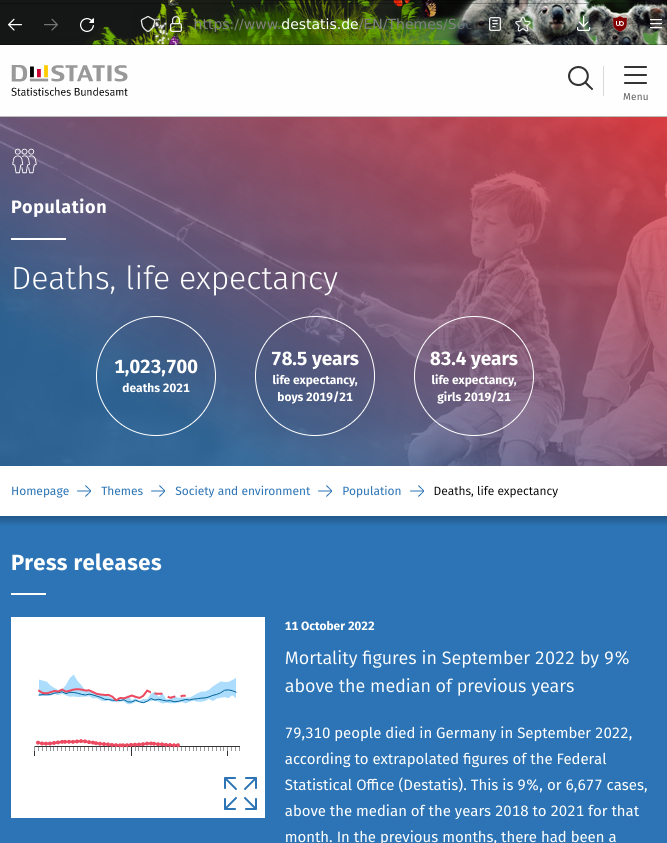
US data

https://www.cdc.gov/nchs/nvss/vsrr/covid19/excess_deaths.htm#data-tables

US, all ages

https://usmortality.com/deaths/excess-cumulative/united-states

Tragic young death

https://nypost.com/2022/10/08/rep-sean-casten-reveals-teen-daughter-died-from-cardiac-arrhythmia/

https://www.foxnews.com/politics/illinois-rep-sean-casten-reveals-teenage-daughter-died-cardiac-arrhythmia

https://www.dailymail.co.uk/news/article-11294477/Illinois-Rep-Sean-Casten-reveals-healthy-teenage-daughter-died-cardiac-arrhythmia.html

https://www.cdc.gov/coronavirus/2019-ncov/vaccines/safety/adverse-events.html

Gwen Casten, 17, died peacefully in her sleep in June,

after eating dinner with her parents and then going out with friends for a few hours.

(Congressman Rep. Sean Casten)

Democrat’s statement

She had just come home from an evening with friends, went to bed and didn’t wake up

The Castens

This past June, our daughter, Gwen Casten, died of a sudden cardiac arrythmia.

In layman’s terms, she was fine, and then her heart stopped
healthy 2022 teenager

fully vaccinated

and had tested positive for COVID-19 more than once in recent months,

but never experienced symptoms.

She had a big, beautiful, kind, loving heart. And it stopped, as all must

China, 20th party congress

President Xi Jinping

https://www.theguardian.com/world/2022/oct/14/chinas-communist-party-congress-everything-you-need-to-know

https://www.bbc.co.uk/news/world-asia-china-63112996

No immediate loosening of zero-Covid strategy

Zero-Covid, people’s war to stop the spread of the virus

Recent weeks

Tens of millions, confined home

60 towns and cities

Dynamic zero-Covid, linked to Mr Xi

Strict lockdowns, mass testing, constant scanning of health codes, travel restrictions

Trains out of Xinjiang suspended

Roadblocks

Widespread reports, food and medicine

Quarantine centres, family separations

IDs linked to health code apps

No vaccine compulsion

(Local vaccines only)

Professor Liang Wannian, government Covid expert panel

Zero-Covid might come to an end?

It’s hard to say

Because one thing I am sure of is, we won’t kill the virus any time soon.

We’re waiting for more effective medicines and more effective vaccines.

2 hours ago: England and Wales Increase in Deaths by Age Group: 62% in Children, 12% in Teens, Almost 20% in Adults, and 16% in Old People

England and Wales Increase in Deaths by Age Group: 62% in Children, 12% in Teens, Almost 20% in Adults, and 16% in Old People

The data has just been published irrespective of age groups. Let’s examine how it affects different age groups. The hypothesis or the assumption the media makes is, only very old (and frail, with “underlying conditions”) folks are dying more. Is that true? Let’s find out.

Pre- (2019) and Post-COVID-19 (2022) in Week 41, based on a full (complete) sample of about 10,000 deaths:

2019 W41
Ages 01-14: 16
Ages 15-44: 302
Ages 45-64: 1,137
Ages 65-74: 1,595
Ages 75-84: 2,869
Ages 85+: 4,008

2022 W41
Ages 01-14: 26
Ages 15-44: 338
Ages 45-64: 1,351
Ages 65-74: 1,901
Ages 75-84: 3,413
Ages 85+: 4,627

Increase:
Ages 01-14: 10 (+62%)
Ages 15-44: 36 (+12%)
Ages 45-64: 214 (+18.8%)
Ages 65-74: 306 (+19.2%)
Ages 75-84: 544 (+19%)
Ages 85+: 621 (+15.5%)
Total: 1731

What is the cause of these massive increases?

Crime?
NHS defunding?
Lack of access to treatment/screening during lockdowns etc.?
Depression/suicide/addiction?
Malnutrition/poverty?
Direct death from COVID-19?
Health damage after COVID-19 contraction?
Effect of vaccines?
Accidents (bath/car)?
Cardiac events (may be related to the above)?
A combination of factors above?

Office for National Statistics (ONS): Deaths This Autumn 21% Higher Than Same Period Prior to COVID-19

Minutes ago ONS released new numbers, as scheduled (every Tuesday). It’s a lot worse than I imagined.

ONS week 41

Now let’s examine the latest data.

Week 41 pre-COVID: (number of deaths in total)

Week 41 pre-COVID

Week 41 this year (new):

Week 41 this year

11,699 – 9,674 = 2,205.

2,205 is 20.93% of 9,674.

Data (ODF): Weeks 1-41

CDC: US Births Decreased About 10% in Half a Decade, Infant Mortality Stayed About the Same

As per official numbers (with vast dataset comprising almost 4 million births per year):

Infant mortality pre- and post-COVID-19: % death in infancy; Pre-COVID-19 (until spring 2019); 2021 onwards

Local copy of underlying data:

2021 CDC data (latest original/archive)
2018 CDC data (2018-19 original/archive)
2017 CDC data (2017-18 original/archive)

Data and chart (based on the above data): Infant mortality pre- and post-COVID-19

Germany Says Deaths Increased by 9% Last Month, But That’s Measuring This Year Compared to Two Years of Pandemic

germany-mortality

Source URL

If one queries for total deaths by year

Year, total deaths, deaths per total:
2016 910,902 11.0% x 0.1
2017 932,272 11.3% x 0.1
2018 954,874 11.5% x 0.1
2019 939,520 11.3% x 0.1
2020 985,572 11.8% x 0.1
2021 1,023,687 12.3% x 0.1

Comparing only Septembers:

2012 September 66,100 10.0% x 0.1
2013 September 65,600 9.9% x 0.1
2014 September 68,526 10.3% x 0.1
2015 September 67,818 10.1% x 0.1
2016 September 69,037 10.2% x 0.1
2017 September 69,391 10.2% x 0.1
2018 September 69,708 10.2% x 0.1
2019 September 71,022 10.4% x 0.1
2020 September 74,243 10.9% x 0.1
2021 September 77,931 11.4% x 0.1

No data shown for this year yet. Same for August:

1990 August 72,310 10.7% x 0.1
1991 August 70,497 10.4% x 0.1
1992 August 71,260 10.4% x 0.1
1993 August 68,081 9.9% x 0.1
1994 August 72,474 10.5% x 0.1
1995 August 68,075 9.8% x 0.1
1996 August 66,041 9.5% x 0.1
1997 August 68,917 9.9% x 0.1
1998 August 67,259 9.7% x 0.1
1999 August 65,429 9.4% x 0.1
2000 August 65,604 9.4% x 0.1
2001 August 66,829 9.6% x 0.1
2002 August 67,259 9.6% x 0.1
2003 August 73,767 10.5% x 0.1
2004 August 65,784 9.4% x 0.1
2005 August 64,075 9.1% x 0.1
2006 August 64,777 9.3% x 0.1
2007 August 64,352 9.2% x 0.1
2008 August 65,605 9.4% x 0.1
2009 August 65,043 9.4% x 0.1
2010 August 67,528 9.7% x 0.1
2011 August 68,570 9.9% x 0.1
2012 August 68,472 10.0% x 0.1
2013 August 68,170 10.0% x 0.1
2014 August 68,610 10.0% x 0.1
2015 August 71,755 10.4% x 0.1
2016 August 71,295 10.2% x 0.1
2017 August 71,488 10.2% x 0.1
2018 August 78,370 11.1% x 0.1
2019 August 73,444 10.4% x 0.1
2020 August 78,742 11.1% x 0.1
2021 August 76,402 10.8% x 0.1

Going back to winter, we have more data:

For 2022 we have (total deaths for the month)

January 87589
February 83044
March 93135

Pre-COVID-19 (2019)

January 85105
February 81009
March 86739

So the population moved from about 0.9% of the population dying per year to 1.2%. Make that a decade and we’re talking about a shift from about 9% to 12%. Longevity/life expectancy is decreasing. So much “progress”, eh?

Data as ODF

Research That Should be Banned

Retrieval statistics: 21 queries taking a total of 0.170 seconds • Please report low bandwidth using the feedback form
Original styles created by Ian Main (all acknowledgements) • PHP scripts and styles later modified by Roy Schestowitz • Help yourself to a GPL'd copy
|— Proudly powered by W o r d P r e s s — based on a heavily-hacked version 1.2.1 (Mingus) installation —|