Introduction About Site Map

XML
RSS 2 Feed RSS 2 Feed
Navigation

Main Page | Blog Index

Archive for the ‘Health’ Category

Office for National Statistics (ONS): Deaths This Autumn 21% Higher Than Same Period Prior to COVID-19

Minutes ago ONS released new numbers, as scheduled (every Tuesday). It’s a lot worse than I imagined.

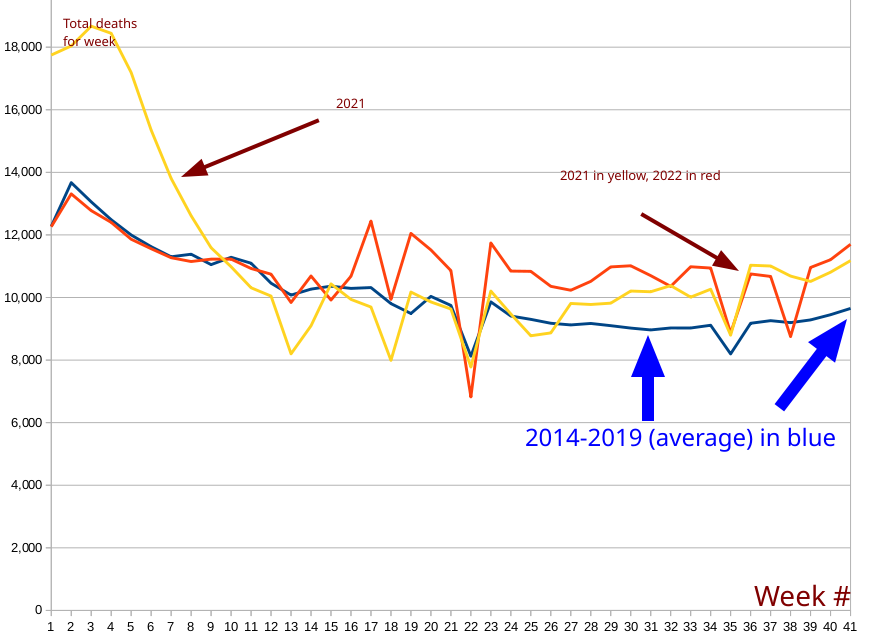
ONS week 41

Now let’s examine the latest data.

Week 41 pre-COVID: (number of deaths in total)

Week 41 pre-COVID

Week 41 this year (new):

Week 41 this year

11,699 – 9,674 = 2,205.

2,205 is 20.93% of 9,674.

Data (ODF): Weeks 1-41

CDC: US Births Decreased About 10% in Half a Decade, Infant Mortality Stayed About the Same

As per official numbers (with vast dataset comprising almost 4 million births per year):

Infant mortality pre- and post-COVID-19: % death in infancy; Pre-COVID-19 (until spring 2019); 2021 onwards

Local copy of underlying data:

2021 CDC data (latest original/archive)
2018 CDC data (2018-19 original/archive)
2017 CDC data (2017-18 original/archive)

Data and chart (based on the above data): Infant mortality pre- and post-COVID-19

Germany Says Deaths Increased by 9% Last Month, But That’s Measuring This Year Compared to Two Years of Pandemic

germany-mortality

Source URL

If one queries for total deaths by year

Year, total deaths, deaths per total:
2016 910,902 11.0% x 0.1
2017 932,272 11.3% x 0.1
2018 954,874 11.5% x 0.1
2019 939,520 11.3% x 0.1
2020 985,572 11.8% x 0.1
2021 1,023,687 12.3% x 0.1

Comparing only Septembers:

2012 September 66,100 10.0% x 0.1
2013 September 65,600 9.9% x 0.1
2014 September 68,526 10.3% x 0.1
2015 September 67,818 10.1% x 0.1
2016 September 69,037 10.2% x 0.1
2017 September 69,391 10.2% x 0.1
2018 September 69,708 10.2% x 0.1
2019 September 71,022 10.4% x 0.1
2020 September 74,243 10.9% x 0.1
2021 September 77,931 11.4% x 0.1

No data shown for this year yet. Same for August:

1990 August 72,310 10.7% x 0.1
1991 August 70,497 10.4% x 0.1
1992 August 71,260 10.4% x 0.1
1993 August 68,081 9.9% x 0.1
1994 August 72,474 10.5% x 0.1
1995 August 68,075 9.8% x 0.1
1996 August 66,041 9.5% x 0.1
1997 August 68,917 9.9% x 0.1
1998 August 67,259 9.7% x 0.1
1999 August 65,429 9.4% x 0.1
2000 August 65,604 9.4% x 0.1
2001 August 66,829 9.6% x 0.1
2002 August 67,259 9.6% x 0.1
2003 August 73,767 10.5% x 0.1
2004 August 65,784 9.4% x 0.1
2005 August 64,075 9.1% x 0.1
2006 August 64,777 9.3% x 0.1
2007 August 64,352 9.2% x 0.1
2008 August 65,605 9.4% x 0.1
2009 August 65,043 9.4% x 0.1
2010 August 67,528 9.7% x 0.1
2011 August 68,570 9.9% x 0.1
2012 August 68,472 10.0% x 0.1
2013 August 68,170 10.0% x 0.1
2014 August 68,610 10.0% x 0.1
2015 August 71,755 10.4% x 0.1
2016 August 71,295 10.2% x 0.1
2017 August 71,488 10.2% x 0.1
2018 August 78,370 11.1% x 0.1
2019 August 73,444 10.4% x 0.1
2020 August 78,742 11.1% x 0.1
2021 August 76,402 10.8% x 0.1

Going back to winter, we have more data:

For 2022 we have (total deaths for the month)

January 87589
February 83044
March 93135

Pre-COVID-19 (2019)

January 85105
February 81009
March 86739

So the population moved from about 0.9% of the population dying per year to 1.2%. Make that a decade and we’re talking about a shift from about 9% to 12%. Longevity/life expectancy is decreasing. So much “progress”, eh?

Data as ODF

Research That Should be Banned

Pfizer Refuses to Explain What It’s Selling

Published a couple of hours ago:

Description/outline (as YouTube will likely remove it at some stage):

Pfizer / European commission vaccine contracts, over 100 blanked out pages

This is how they were disclosed to us, (MEP Cristian Terhes)

Over 100 blacked out pages

https://www.eppo.europa.eu/en

Full hearing of Pfizer’s representative before the European Commission

https://youtu.be/5A2ZkW8pUWg

My video based on available content at the time

https://www.youtube.com/watch?v=J6VbI8gOnUM

Press conference after Pfizer CEO Albert Bourla refused to answer in front of European Parliament

https://www.youtube.com/watch?v=2jTgDj7uiX8

Six members of the European Parliament held a press conference on October 11, 2022, one day after Albert Bourla, Pfizer CEO, refused to participate in the Covid committee and answer questions.

MEP Francesca Donato (Italy)

MEP Cristian Terhes (Romania)

MEP Virginie Jeron (France)

MEP Sylvia Limmer (Germany)

MEP Ivan Sincic (Croatia)

MEP Christine Anderson (Germany)

YT guidelines

COVID-19 medical misinformation policy

https://support.google.com/youtube/answer/9891785

Prevention misinformation:

Content that promotes prevention methods that contradict local health authorities or WHO.

Claims that there is a guaranteed prevention method for COVID-19

Claims that any medication or vaccination is a guaranteed prevention method for COVID-19

https://support.google.com/youtube/answer/11161123

Vaccine safety: content alleging that vaccines cause chronic side effects, outside of rare side effects that are recognized by health authorities

Efficacy of vaccines: content claiming that vaccines do not reduce transmission or contraction of disease

Ingredients in vaccines: content misrepresenting the substances contained in vaccines

MEP Virginie Jeron (France)

My colleagues have perfectly summarised the masquerade (farce) of yesterdays meeting

None of the questions we asked, which were very clear;

Contracts, prices, xxxxxx, were not answered.

Pfizer should be required to give evidence under oath

Because this is an official hearing.

This was the biggest contract ever awarded by the European Commission, E 36 billion

European court paper, 35 pages of questions, criticisms, demands, lack of transparency – none answered

Suspicions of passive corruption, to be put into action

I have contacted a legal firm in France

Summary, they came, they did not answer anything, and they are still selling us their products.

COVID-19 in England in October (10): Over 10 Thousand in Hospital, Over a Thousand Admitted Per Day, Over 10% Testing Positive (PCR)

So far in October, the 10th month, we’ve been seeing 19% more deaths than before the pandemic (in England and Wales).

So the problem has clearly not been tackled. Changing Prime Minister won’t fix this, either.

Half an hour ago figures came out for the past week.

Number of COVID-19 patients in hospital, by date:

19-10-2022 10,387
18-10-2022 10,594
17-10-2022 10,688
16-10-2022 10,584
15-10-2022 10,502
14-10-2022 10,420
13-10-2022 10,524
12-10-2022 10,608
11-10-2022 10,522
10-10-2022 10,397
09-10-2022 10,181
08-10-2022 10,049
07-10-2022 10,070

Number of COVID-19 patients added to hospital, by date:

17-10-2022 1,121
16-10-2022 1,206
15-10-2022 900
14-10-2022 978
13-10-2022 1,247
12-10-2022 1,150
11-10-2022 1,207
10-10-2022 1,275
09-10-2022 1,252
08-10-2022 885
07-10-2022 946
06-10-2022 1,163
05-10-2022 1,259
04-10-2022 1,418
03-10-2022 1,344
02-10-2022 1,262
01-10-2022 1,091
30-09-2022 870
29-09-2022 1,158
28-09-2022 1,134
27-09-2022 1,045

England’s number of PCR tests and positivity rate

10-10-2022 160,558 9.9%
09-10-2022 161,342 10.2%
08-10-2022 161,482 10.4%
07-10-2022 160,927 10.5%
06-10-2022 158,922 10.5%
05-10-2022 157,623 10.4%
04-10-2022 155,269 10.4%
03-10-2022 151,261 10.1%
02-10-2022 150,281 9.7%
01-10-2022 150,200 9.4%

‘COVID Effect’: Almost 20% Increase in England and Wales Deaths in Latest Week’s Data From Office for National Statistics (ONS)

Comparing pre-COVID years to 2022 mortality levels

Some new numbers were published just over a day ago:

ONS report

To quote the summary: “In the week ending 7 October 2022 (Week 40), 11,207 deaths were registered in England and Wales; 400 of these deaths mentioned “novel coronavirus (COVID-19)”, accounting for 3.6% of all deaths.”

But how many of them were COVID survivors just ‘limping along’ and dying later without that counting as COVID-19 linked?

Further down it says: “The number of deaths registered in the UK in the week ending 7 October 2022 (Week 40) was 12,793, which was 13.7% above the five-year average (1,538 excess deaths); of these deaths, 449 involved COVID-19, which was 106 more than in Week 39.”

But this 5-year average includes 3 years of COVID-19 (this year, 2021, and 2020), so let’s go back in time and see pre-COVID death rates for this wee.

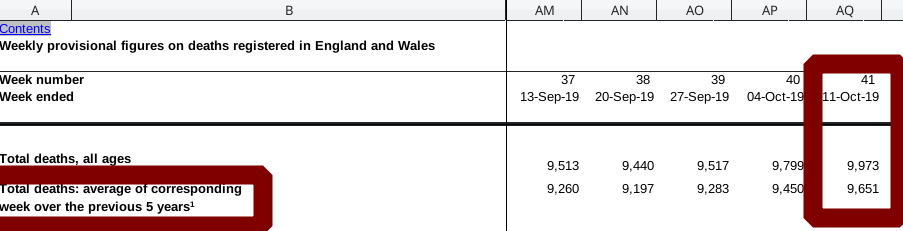
In 2019 week 40 had 9,799 deaths and the 5-year average was 9,450. See screenshot (we already uploaded the original report as ODF):

Deaths 2019 in England and Wales

11,207 – 9,450 = 1757.

So for this week alone, for England and Wales alone, we’re 1757 higher than the 5-year average of pre-COVID levels.

1757 is almost 19% of 9,450, so we’re taking about an increase of almost 20% of this week.

Retrieval statistics: 21 queries taking a total of 0.649 seconds • Please report low bandwidth using the feedback form
Original styles created by Ian Main (all acknowledgements) • PHP scripts and styles later modified by Roy Schestowitz • Help yourself to a GPL'd copy
|— Proudly powered by W o r d P r e s s — based on a heavily-hacked version 1.2.1 (Mingus) installation —|