Introduction About Site Map

XML
RSS 2 Feed RSS 2 Feed
Navigation

Main Page | Blog Index

Archive for the ‘Health’ Category

New Video: Neonatal Deaths on the Rise

The video’s description (in case Google will take down the video/channel, which seems likely):

Review of Neonatal Mortality in Scotland

https://www.healthcareimprovementscotland.org/our_work/governance_and_assurance/programme_resources/neonatal_mortality_in_scotland.aspx

Healthcare Improvement Scotland, asked by Scottish Government

Review of significant increase in neonatal mortality

2021 to 2022

Scottish Government orders review as neonatal deaths higher than expected

https://www.bbc.co.uk/news/uk-scotland-63097142

Neonatal death rates, two spikes over six-months

September 2021, at least 21 babies under 4 weeks died

March 2022, at least 18 babies under 4 weeks died

Average mortality rate among newborns

Two per 1,000 births.

In September 2021, 4.9 per 1,000 births

March 2020, 4.6 per 1,000 births

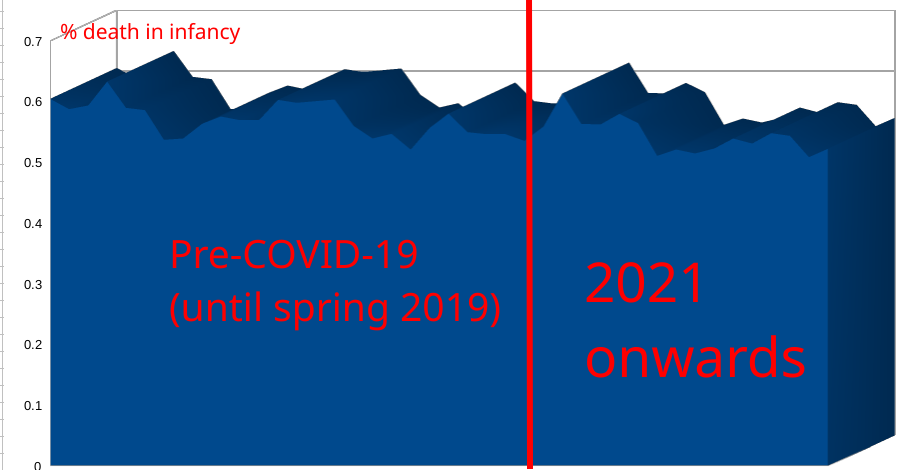
For all of 2021, 3.9 infant deaths for every thousand live births

For all of 2020, 3.1

(A preliminary investigation found the September spike was not linked to Covid)

This form of monitoring introduced, July 2017

Dr Sarah Stock, maternal and foetal medicine, University of Edinburgh

https://www.scotsman.com/health/scottish-government-orders-review-as-neonatal-deaths-higher-than-expected-3863538

I think the numbers are really troubling and I don’t think we know the reasons why yet.

What we do know it’s not neonatal Covid – the rates of Covid-19 infection in babies are very low and deaths from Covid are thankfully very, very small,

so this isn’t Covid affecting babies

Covid Scotland: Vaccines ruled out in neonatal deaths spike

https://www.heraldscotland.com/news/23028843.covid-scotland-vaccines-ruled-cause-neonatal-deaths-spike/?ref=rss

PUBLIC health experts ruled out any link between spikes in neonatal deaths and the Covid vaccine

without checking whether any of the infants’ mothers had received the jag during pregnancy.

Experts stressed, no “plausible” link to justify investigating maternal vaccination status.

Public Health Scotland (PHS) said its consultants had given “careful consideration” to the “potential benefits and harms” of carrying out such as analysis as part of its probe into the tragic deaths of 39 infants,

but concluded against doing so

PHS added

A risk that “identifying the vaccination status of the mothers, even at aggregate level,

would result in harm to those individuals and others close to them,

through actual or perceived judgement of the effects of their personal vaccination decision”

Furthermore

“the outcomes of such analysis, whilst being uninformative for public health decision making,

had the potential to be used to harm vaccine confidence at this critical time”

PHS response, “We do not have any plans to examine maternal vaccination status, as there is no public health reason to do so”.

NHS logging baby deaths as stillbirths ‘to avoid scrutiny’

https://www.telegraph.co.uk/news/2022/10/16/nhs-logging-baby-deaths-stillbirths-avoid-scrutiny/

Families call into question trusts’ transparency after hospital accounts clash with their experience

NHS hospitals have claimed that babies born alive were stillborn

prompting accusations they were trying to avoid scrutiny.

Six children who died before they left hospital were wrongly described as stillborn.

Several of the children lived for minutes and one lived for five days.

https://www.gov.uk/government/news/new-powers-to-investigate-stillbirths

At present, coroners can only hold inquests for babies who have shown signs of life after being born.

The babies identified by The Telegraph should have been recorded as neonatal deaths, but staff claimed they were stillbirths

‘Our baby was alive for five days but was recorded as a stillbirth’

CDC Data: Mortality Rates in the United States by Age Groups (2017-2020)

Mortality in the United States, 2018, fig3

Mortality in the United States, 2020, fig3

Personal observation: in my age group the death rate exploded by 25%. In just one year! Based on more recent data (with no age group separation), 2022 is no better than 2020.

References

NOTE: There is no similar study later than the above. See the date below.

CDC on mortality

Related: CDC Data: US Deaths About 25% Higher This Winter Than Last Winter Before COVID-19 (Updated)

The Conspicuous Table of England COVID-19 Vaccination Rates (NIMS)

Published days ago:

england-vaccine-figures

The COVID-19 official portal gives rather different figures:

COVID-19 official portal

Are they measuring the same thing?

One figure mentions a total of 62 million. Are they non-citizen residents of England? Clarifications needed. If statistics they present us with are misleading, maybe they should be revised. In Switzerland, for instance, they openly admit less than 70% are fully vaccinated for COVID-19.

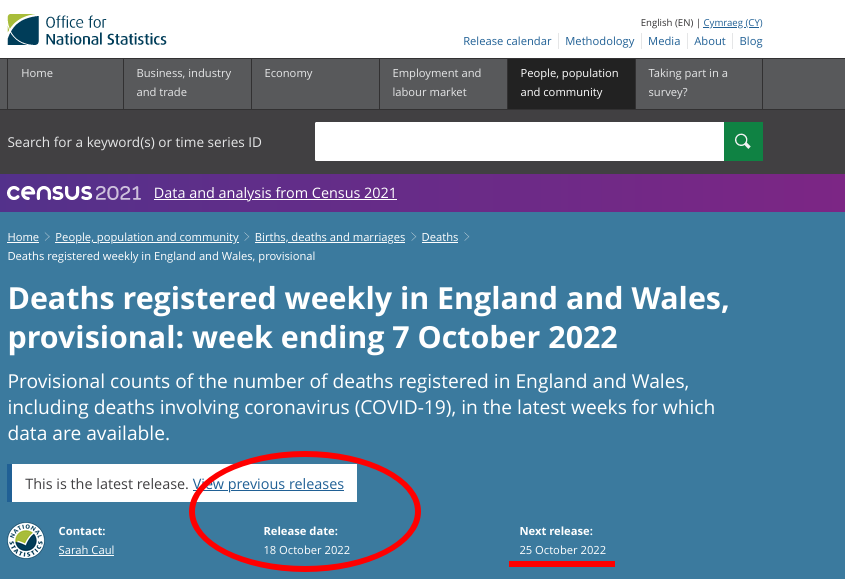
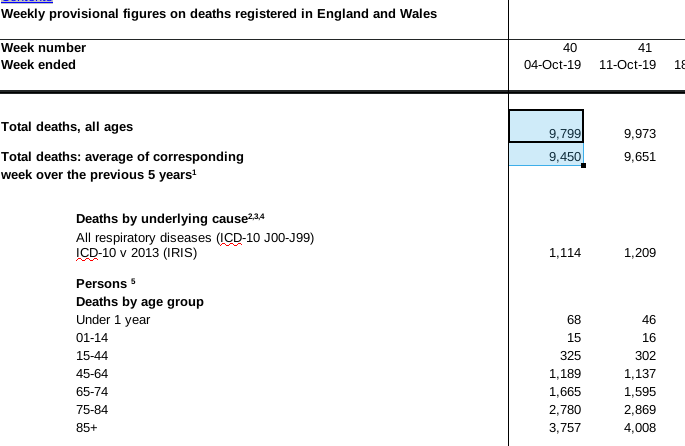
4 Months Later, Office for National Statistics (ONS) Data on England and Wales Deaths Remains Uncorrected

It could not possibly be this low. Where are those missing deaths? Dispersed across other weeks? Lost in Microsoft Excel? Undated? The documents shown here do not say (week 25 and week 24).

This is statistically impossible (HSA cites ONS)

ONS missing data

The original from ONS:

ONS data

Not corrected a week later:

HSA numbers missing

Now in October there is still no correction of those figures.

UK COVID-19 Vaccination Statistics Partly Fabricated… Or…?

From the description (gist):

ONS vaccination data

https://www.ons.gov.uk/peoplepopulationandcommunity/healthandsocialcare/conditionsanddiseases/articles/coronaviruscovid19latestinsights/vaccines

In the UK by the end of August 2022, of those aged 12 years and over:

93.6% had received a first dose of a COVID-19 vaccine

88.2% had received a second dose

70.2% had received three or more doses

Therefore 6.4% of over 12s are totally unvaccinated

Weekly national Influenza and COVID-19 surveillance report

Week 41 report (up to week 40 data) 13 October 2022

https://assets.publishing.service.gov.uk/government/uploads/system/uploads/attachment_data/file/1110820/Weekly_Flu_and_COVID-19_report_w41.pdf

(Page 74)

Cumulative data up to week 40 2022 (week ending 9 October 2022) was extracted from the National Immunisation Management Service (NIMS).

The vaccine uptake rate, aged 18 and over

82.5% for dose 1

79.7% for dose 2

65.8% for dose 3

UK, HSA

Therefore 17.5% of over 18s are totally unvaccinated

UK, ONS

Therefore 6.4% of over 12s are totally unvaccinated

Given that vaccination rates are lower in 12 to 18, as compared to over 18s,

We would expect the percentage of unvaccinated in over 12s to be higher.

So his discrepancy is even greater that it appears

Vaccine rates are lower between 12 to 18

(compared to over 18s)

Implications of the Office for National Statistics estimates of Covid-19 vaccine take up in England on the representativeness of its sample population

(October 2022)

https://www.researchgate.net/publication/364310694_Implications_of_the_Office_for_National_Statistics_estimates_of_Covid-19_vaccine_take_up_in_England_on_the_representativeness_of_its_sample_population?channel=doi&linkId=63459d419cb4fe44f31d90fd&showFulltext=true

Most recent vaccine mortality surveillance report the UK's Office for National Statistics (ONS),

estimated just 8% of adults in England were unvaccinated by the end of May 2022.

However, the ONS estimates are based on a special subset of the England population.

Other independent estimates for the whole of the population in May were higher:

the UK Health Security Agency (UKHSA) estimated 20%,

while a large independent survey by ICM found 26%.

https://www.icmunlimited.com/our-work/exploring-attitudes-towards-covid-19-vaccinations-for-stv/

Assuming the ONS estimate is correct for its subset of the England population,

and that the other independent estimates of between 20 and 26% for the whole population are also correct,

then between 69% and 99.6% of adults missing from the ONS sample are unvaccinated.

This would mean the ONS sample is unrepresentative of the whole England population and any conclusions about vaccine take-up,

efficacy and safety based on the ONS data may not be relevant to the population as a whole.

If the ONS is not underestimating the proportion of unvaccinated in its sample,

then we have shown that the sample is so unrepresentative of the whole population that any inferences made
about the vaccination programme using the ONS data are worthless.

Ireland’s Death (Mortality) Data: Deaths Not Slowing Down Since Pandemic’s Peak, Totals Still 11% Higher Than Pre-Pandemic

Ireland's death data

UPLOADED and shown at the bottom are the raw, official, unaltered datasets. All I changed was the format to make it an open standard. The data is from this official portal, last Updated: 24/08/2022 (see screenshot above).

We now have Q1 data for this year (nothing later than this has been made publicly available yet), so we can compare apples to apples.

2017 Q1: 9067
2018 Q1: 9278
2019 Q1: 8618
2020 Q1: 8674
2021 Q1: 9564
2022 Q1: 9535

That’s 917 more (this year) deaths than in 2019 (pre-pandemic) or 10.6% higher.

And here’s all the data as ODF files:

This is consistent with what we see in the UK. In the US it’s a lot worse.

CDC Data: US Deaths About 25% Higher This Winter Than Last Winter Before COVID-19 (Updated)

Latest data as ODF (via: By state and totals

Number of deaths 2018 and 2019:

2019 March 253,000
2019 February 232,000
2019 January 257,000

2018 December 249,000
2018 November 233,000
2018 October 234,000
2018 September 219,000
2018 August 224,000
2018 July 225,000
2018 June 220,000
2018 May 229,000
2018 April 233,000
2018 March 249,000
2018 February 237,000
2018 January 287,000

Compare to the ODF above (it goes up until March 2022)

January-March 2018: 287,000, 237,000, 249,000
January-March 2019: 257,000, 232,000, 253,000 (total: 742,000)
January-March 2021: 373,000, 282,000, 270,000
January-March 2022: 368,000, 288,000, 266,000 (total: 922,000)

922,000 is 24.2% more than 742,000.

Update: 2016 and 2017 figures show that compared to 2016 (202,000 deaths fewer than 2022) there is a 27.2% increase.

The numbers are:

January-March 2016: 246,000, 230,000, 244,000
January-March 2017: 263,000, 234,000, 251,000

The differences are profound.

Retrieval statistics: 21 queries taking a total of 0.121 seconds • Please report low bandwidth using the feedback form
Original styles created by Ian Main (all acknowledgements) • PHP scripts and styles later modified by Roy Schestowitz • Help yourself to a GPL'd copy
|— Proudly powered by W o r d P r e s s — based on a heavily-hacked version 1.2.1 (Mingus) installation —|