ONS vaccination data
https://www.ons.gov.uk/peoplepopulationandcommunity/healthandsocialcare/conditionsanddiseases/articles/coronaviruscovid19latestinsights/vaccines
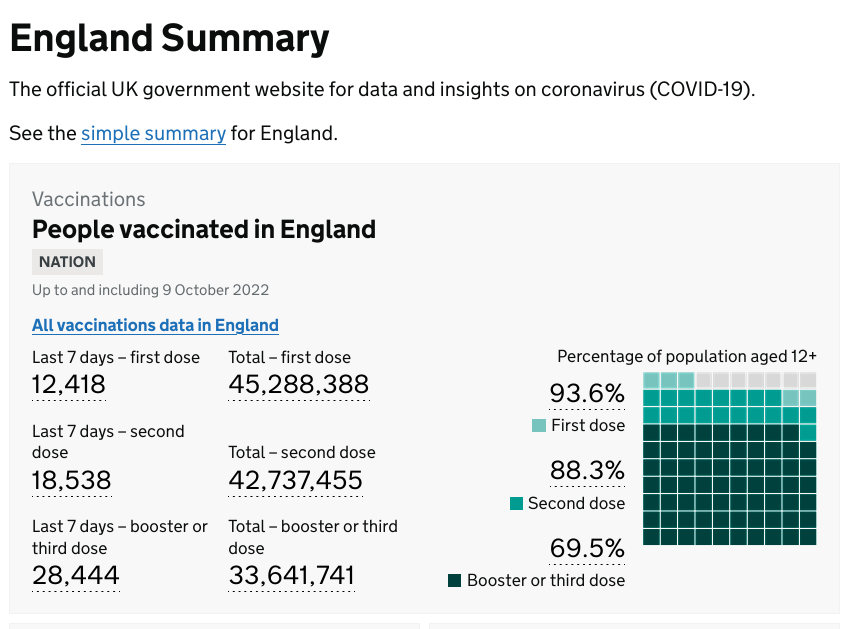
In the UK by the end of August 2022, of those aged 12 years and over:
93.6% had received a first dose of a COVID-19 vaccine
88.2% had received a second dose
70.2% had received three or more doses
Therefore 6.4% of over 12s are totally unvaccinated
Weekly national Influenza and COVID-19 surveillance report
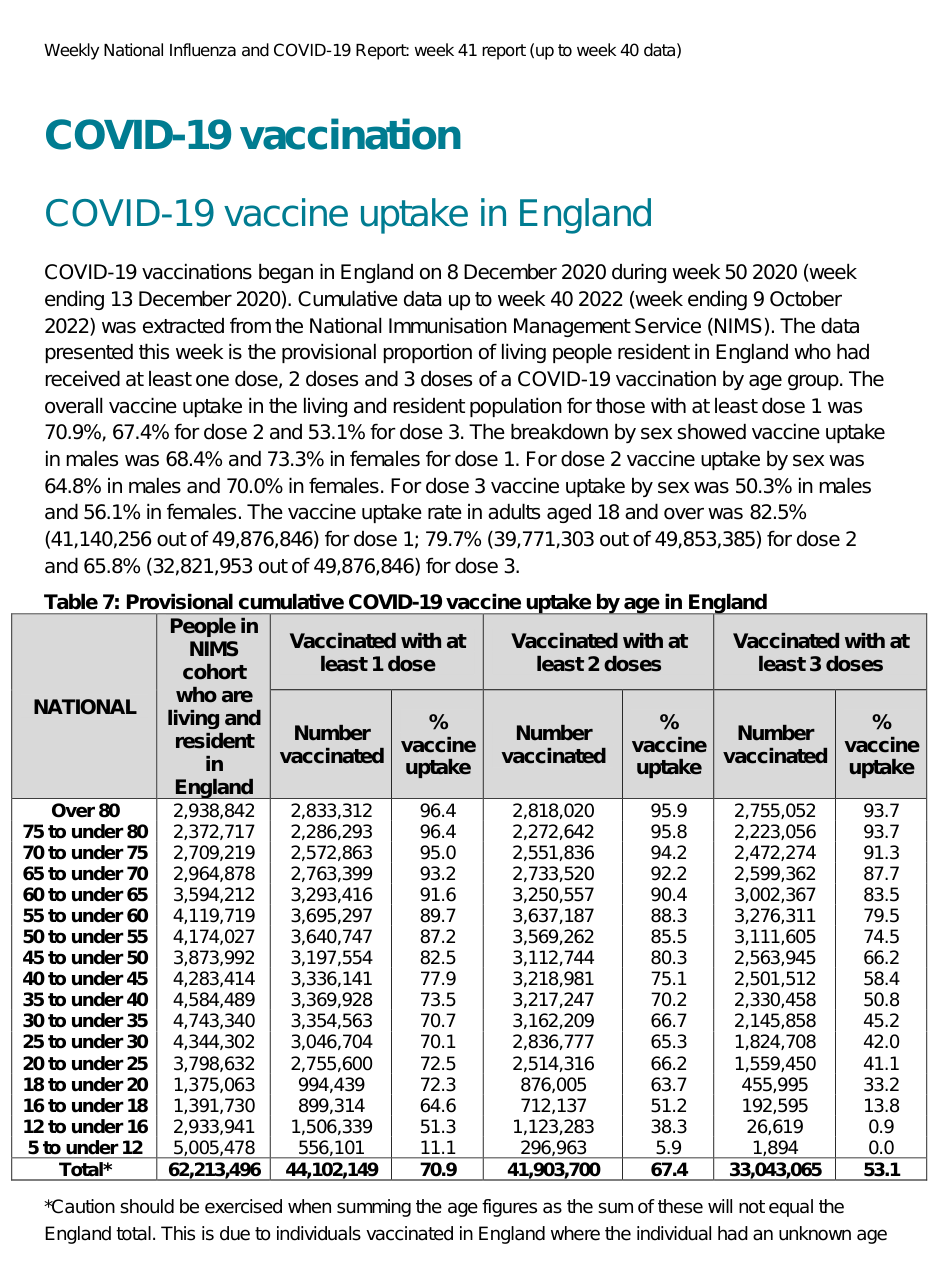
Week 41 report (up to week 40 data) 13 October 2022
https://assets.publishing.service.gov.uk/government/uploads/system/uploads/attachment_data/file/1110820/Weekly_Flu_and_COVID-19_report_w41.pdf
(Page 74)
Cumulative data up to week 40 2022 (week ending 9 October 2022) was extracted from the National Immunisation Management Service (NIMS).
The vaccine uptake rate, aged 18 and over
82.5% for dose 1
79.7% for dose 2
65.8% for dose 3
UK, HSA
Therefore 17.5% of over 18s are totally unvaccinated
UK, ONS
Therefore 6.4% of over 12s are totally unvaccinated
Given that vaccination rates are lower in 12 to 18, as compared to over 18s,
We would expect the percentage of unvaccinated in over 12s to be higher.
So his discrepancy is even greater that it appears
Vaccine rates are lower between 12 to 18
(compared to over 18s)
Implications of the Office for National Statistics estimates of Covid-19 vaccine take up in England on the representativeness of its sample population
(October 2022)
https://www.researchgate.net/publication/364310694_Implications_of_the_Office_for_National_Statistics_estimates_of_Covid-19_vaccine_take_up_in_England_on_the_representativeness_of_its_sample_population?channel=doi&linkId=63459d419cb4fe44f31d90fd&showFulltext=true
Most recent vaccine mortality surveillance report the UK's Office for National Statistics (ONS),
estimated just 8% of adults in England were unvaccinated by the end of May 2022.
However, the ONS estimates are based on a special subset of the England population.
Other independent estimates for the whole of the population in May were higher:
the UK Health Security Agency (UKHSA) estimated 20%,
while a large independent survey by ICM found 26%.
https://www.icmunlimited.com/our-work/exploring-attitudes-towards-covid-19-vaccinations-for-stv/
Assuming the ONS estimate is correct for its subset of the England population,
and that the other independent estimates of between 20 and 26% for the whole population are also correct,
then between 69% and 99.6% of adults missing from the ONS sample are unvaccinated.
This would mean the ONS sample is unrepresentative of the whole England population and any conclusions about vaccine take-up,
efficacy and safety based on the ONS data may not be relevant to the population as a whole.
If the ONS is not underestimating the proportion of unvaccinated in its sample,
then we have shown that the sample is so unrepresentative of the whole population that any inferences made
about the vaccination programme using the ONS data are worthless.


 Filed under:




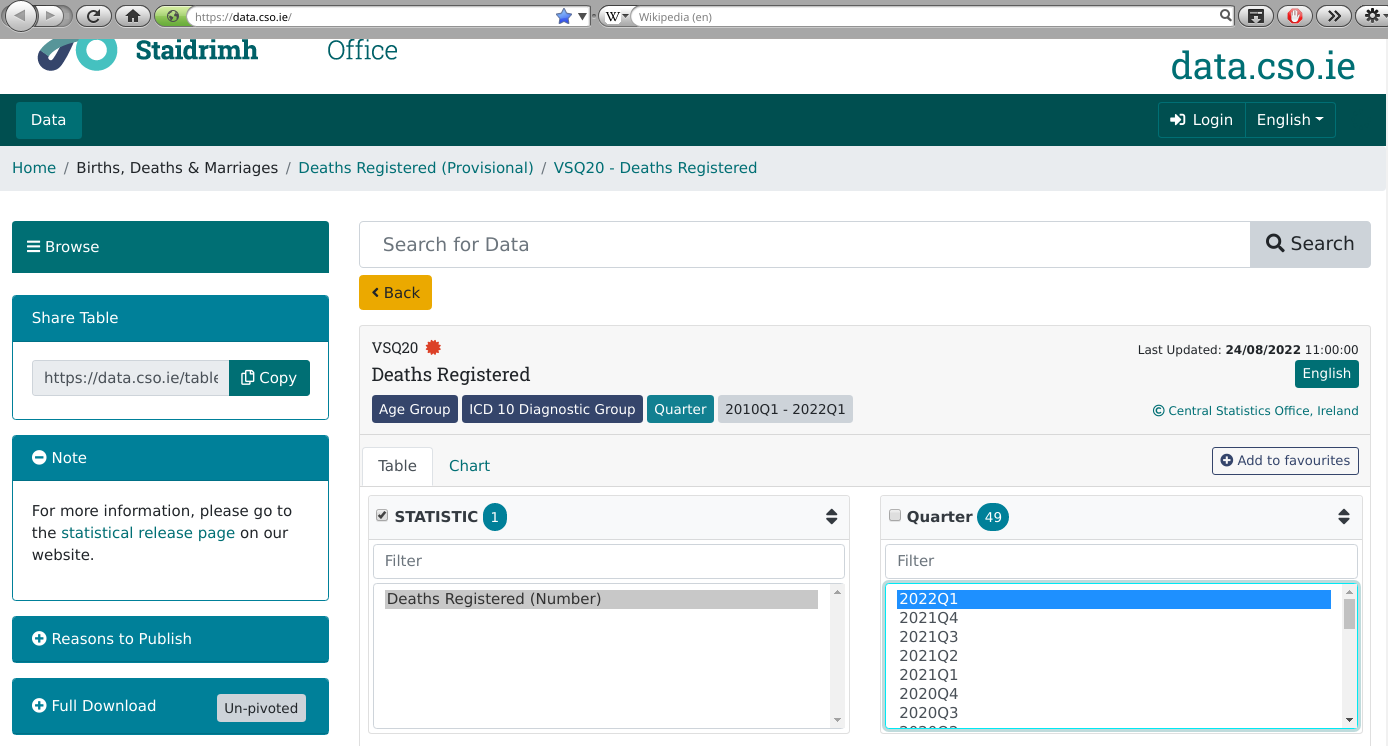
 PLOADED and shown at the bottom are the raw, official, unaltered datasets. All I changed was the format to make it an open standard. The data is from