Introduction About Site Map

XML
RSS 2 Feed RSS 2 Feed
Navigation

Main Page | Blog Index

Archive for the ‘Research’ Category

Checking What Causes So Many Deaths in UK and Australia

New:

Video notes:

Investigating cause of excess deaths

In 1965, English statistician Sir Austin Bradford Hill

Causal relationships

Strength

The larger the association, the more likely that it is causal

Consistency, (reproducibility)

Consistent findings, different persons in different places

Specificity

No other likely explanation

Temporality

The effect has to occur after the cause (often with a delay)

Biological gradient, (dose response relationship)

Greater exposure should lead to greater incidence of the effect

(or indeed lower incident of effect)

Plausibility

A plausible mechanism between cause and effect

Coherence

Between epidemiological and laboratory findings

Experiment

Occasionally it is possible to appeal to experimental evidence

Analogy

Analogies or similarities between the observed association and any other associations

Reversibility

May work if there is no permanent damage

Massive Increase in Deaths After COVID-19, Even as We Enter 2023 (Many Die Suddenly at Home, Including Young People)

New video:

Description:

Excess deaths, different countries and different age groups

https://www.abs.gov.au/statistics/health/causes-death/provisional-mortality-statistics/latest-release

In 2022

144,650 deaths that occurred by 30 September

(and were registered by 30 November),

which is 19,986 (16.0%) more than the historical average

(compared to 2015-2019)

Same period

8,160 deaths due to COVID-19 that were certified by a doctor

Non covid excess deaths
= 11,826

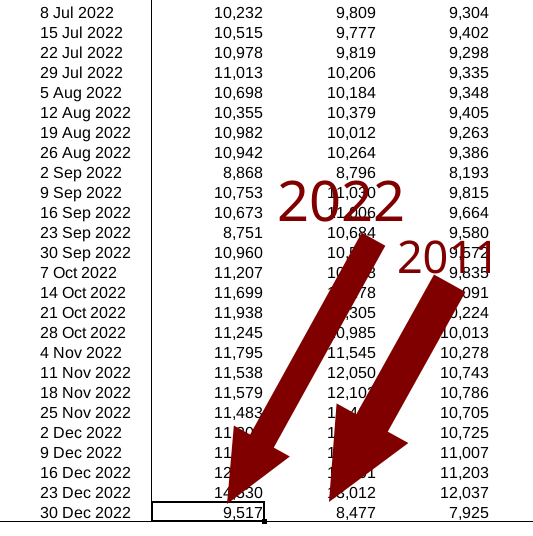
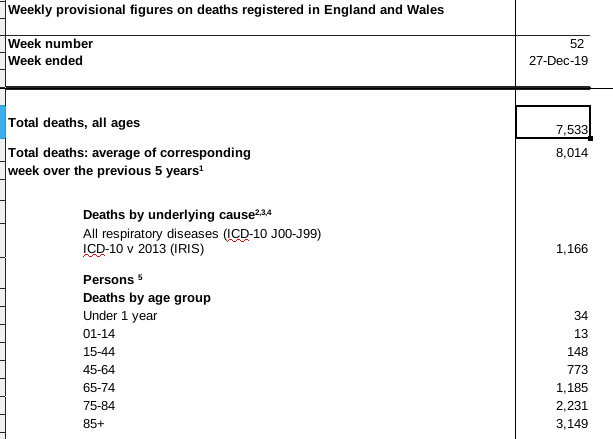
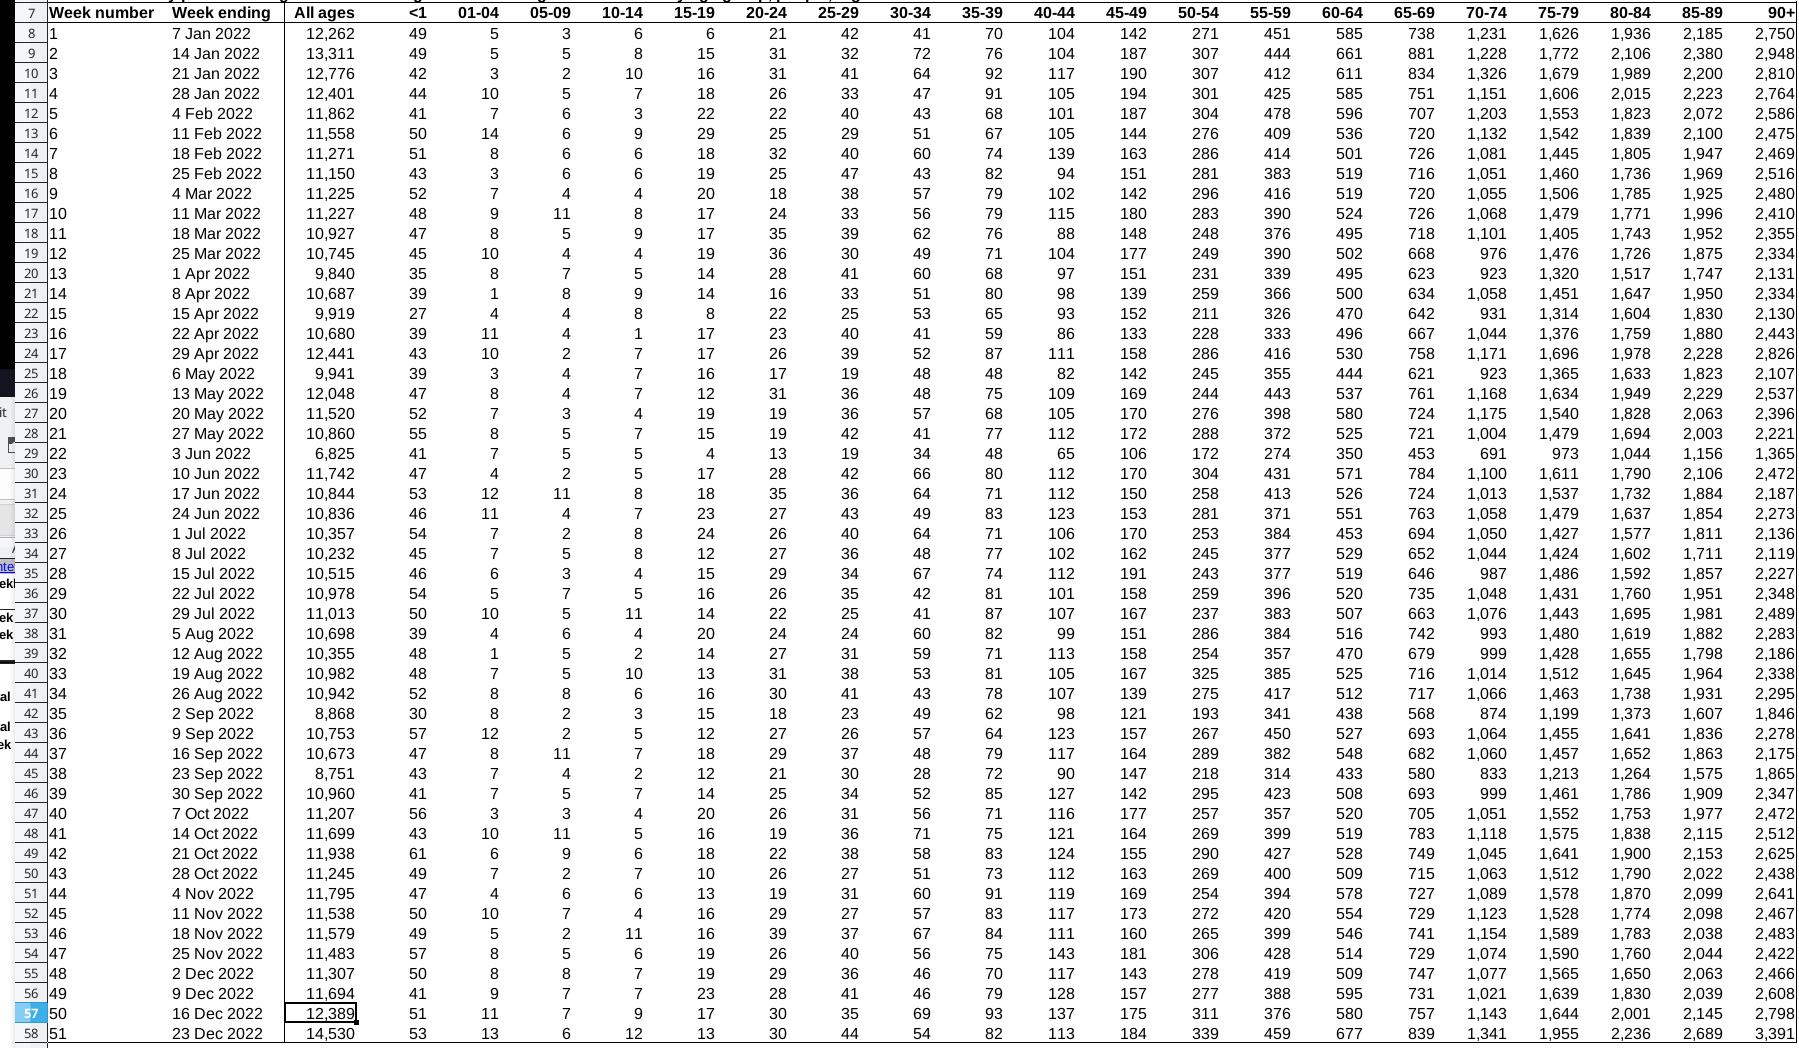
Week ending 30 December 2022 (Week 52)

https://www.ons.gov.uk/peoplepopulationandcommunity/birthsdeathsandmarriages/deaths/bulletins/deathsregisteredweeklyinenglandandwalesprovisional/latest

9,517 deaths were registered in England and Wales

(393 mentioned “novel coronavirus, COVID-19)

The number of deaths was above the five-year average

Private homes, 36.9% above, (684 excess deaths)

Hospitals, 14.8% above, (537 excess deaths)

Care homes 20.4% above, (371 excess deaths)

Other settings 0.2% above, (1 excess death)

Total excess deaths, week 52 = 1,593

Percentage change compared to 5-year average (2016 to 2019 and 2021) for week 52

20.1%

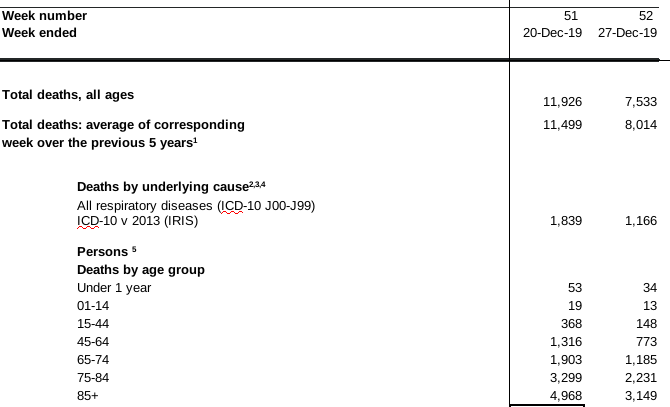
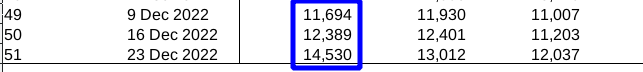
Week ending 23rd December England and Wales, (week 51)

All-cause deaths registered 14,530

(COVID-19 accounted for 429, 3.0%)

Number of deaths was above the five-year average

Private homes (37.5% above, 1,120 excess deaths)

Hospitals (18.8% above, 1,031 excess deaths)

Care homes (10.5% above; 282 excess deaths)

Other settings (7.0% above, 61 excess deaths) in Week 51 in England and Wales.

Total excess deaths, week 51 = 2,492

Excess deaths in all UK age groups

https://app.powerbi.com/view?r=eyJrIjoiYmUwNmFhMjYtNGZhYS00NDk2LWFlMTAtOTg0OGNhNmFiNGM0IiwidCI6ImVlNGUxNDk5LTRhMzUtNGIyZS1hZDQ3LTVmM2NmOWRlODY2NiIsImMiOjh9

Data goes up to 18th November 2022

Investigating cause of excess deaths

In 1965, English statistician Sir Austin Bradford Hill

Causal relationships

Strength

The larger the association, the more likely that it is causal

Consistency, (reproducibility)

Consistent findings, different persons in different places

Specificity

No other likely explanation

Temporality

The effect has to occur after the cause (often with a delay)

Biological gradient, (dose response relationship)

Greater exposure should lead to greater incidence of the effect

(or indeed lower incident of effect)

Plausibility

A plausible mechanism between cause and effect

Coherence

Between epidemiological and laboratory findings

Experiment

Occasionally it is possible to appeal to experimental evidence

Analogy

Analogies or similarities between the observed association and any other associations

Reversibility

May work if there is no permanent damage

2019 Week 52 Deaths: 7,533. 2022 Week 52 Deaths: 9,517 (26.3% Increase!)

Very sharp increase in total deaths just 3 years later. Where’s the government investigation?

2022

Total deaths and average 2022

2019:

Total deaths and average 2019

With numbers like these, only the gullible and deeply misinformed would think the pandemic is “over”.

Week 51 (Christmas) Deaths by Age Group in England and Wales: 2019 and 2022 Compared, According to ONS (the Government’s Official) Figures

2019:

Week 51 deaths in 2019

2022:

Deaths in 2022

Kids under 1

2019: 53 deaths
2023: 53 deaths

Kids aged 1-14

2019: 19 deaths
2023: 31 deaths

People aged 15-44

2019: 368 deaths
2023: 336 deaths

People aged 45-64

2019: 1,316 deaths
2023: 1,659 deaths

People aged 65-74

2019: 1,903 deaths
2023: 2,180 deaths

People aged 75-84

2019: 3,299 deaths
2023: 4,191 deaths

People aged over 85

2019: 4,968 deaths
2023: 6,080 deaths

So deaths grew by a lot, but older people were the main component of this increase.

This Might Help Explain Massive Increase in UK Mortality in Recent Years

Via this new video:

2022 data from Swindon

Myocarditis

So there seems to be a ‘pandemic of heart conditions’ now.

Yesterday: ONS: England and Wales Deaths in Week 51 (Xmas) Rose From 11.5K Before Pandemic to 14.5K in 2022 (26.4% Increase)

The COVID-19 Statistics Are… (UPDATED)

Delayed again. After several weeks of nothing… still nothing.

COVID delay

“Today’s update is delayed. The estimated release time is 5.00pm.”

The deaths are very high despite incomplete data.

Well, SKY ‘NEWS’ said one hour ago that there’s a fall in flu and COVID cases. But deaths are up sharply across the UK. The mainstream media seems to be actively lying to people in order to impose optimism on the peasantry.

The risk of death remains high, not just for old people.

UPDATE

So the data is now belatedly out… but it’s missing data:

Missing data again

At this stage it’s no longer possible to even trust our government’s count of how many people are dying.

ONS: England and Wales Deaths in Week 51 (Xmas) Rose From 11.5K Before Pandemic to 14.5K in 2022 (26.4% Increase)

Their numbers are not reliable anymore, but here’s the data for week 51 (two weeks ago):

Xmas 2022 deaths

Compared to pre-pandemic levels:

Cmas deaths in 2019

Xmas deaths, average for 2014-19: 11.5k
For 2022: 14.5k

But don’t worry, that’s just about 3,000 more dead people than before…. in one week! And nobody will notice, merry Xmas everyone!!

That’s 26.4% increase in deaths, but they tell us to quit worrying about the COVID-19 pandemic, side effects of vaccines (dare to suggest any exist and they’ll call you “antivaxer”), and the NHS crisis in general.

Retrieval statistics: 21 queries taking a total of 0.316 seconds • Please report low bandwidth using the feedback form
Original styles created by Ian Main (all acknowledgements) • PHP scripts and styles later modified by Roy Schestowitz • Help yourself to a GPL'd copy
|— Proudly powered by W o r d P r e s s — based on a heavily-hacked version 1.2.1 (Mingus) installation —|