Introduction About Site Map

XML
RSS 2 Feed RSS 2 Feed
Navigation

Main Page | Blog Index

Archive for the ‘Research’ Category

This Might Help Explain Massive Increase in UK Mortality in Recent Years

Via this new video:

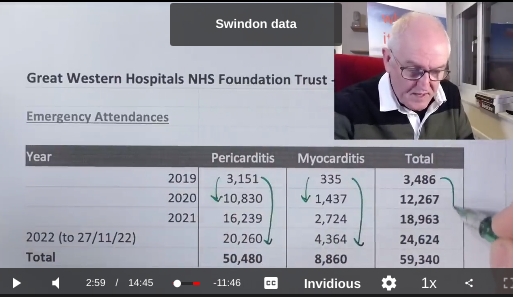
2022 data from Swindon

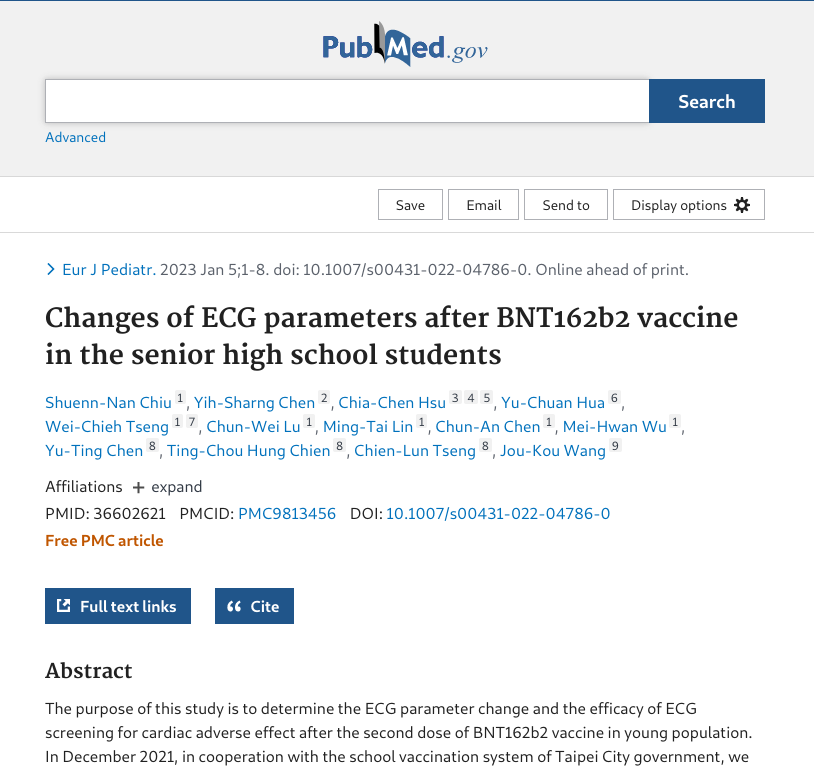
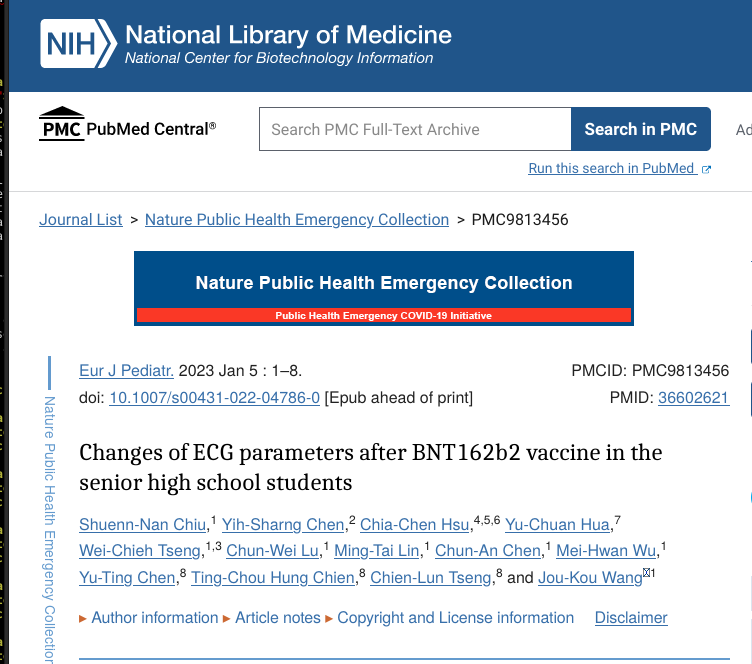
Myocarditis

So there seems to be a ‘pandemic of heart conditions’ now.

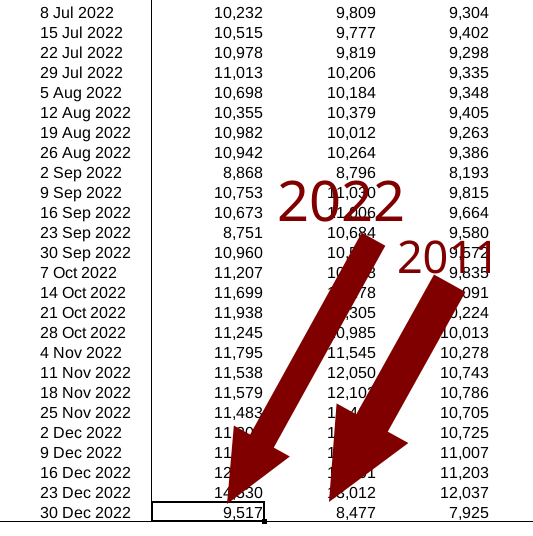
Yesterday: ONS: England and Wales Deaths in Week 51 (Xmas) Rose From 11.5K Before Pandemic to 14.5K in 2022 (26.4% Increase)

The COVID-19 Statistics Are… (UPDATED)

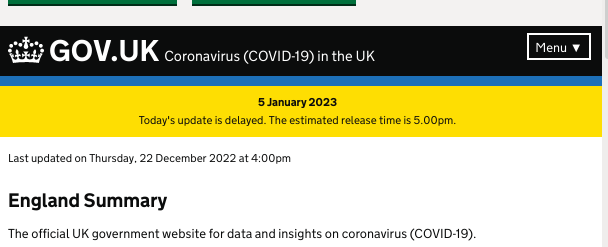
Delayed again. After several weeks of nothing… still nothing.

COVID delay

“Today’s update is delayed. The estimated release time is 5.00pm.”

The deaths are very high despite incomplete data.

Well, SKY ‘NEWS’ said one hour ago that there’s a fall in flu and COVID cases. But deaths are up sharply across the UK. The mainstream media seems to be actively lying to people in order to impose optimism on the peasantry.

The risk of death remains high, not just for old people.

UPDATE

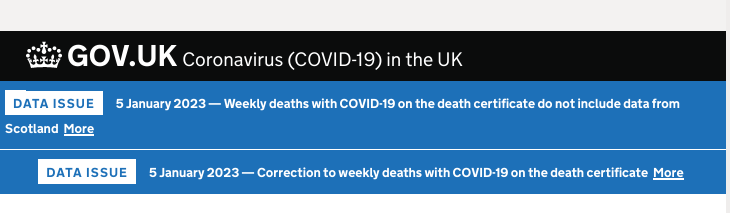
So the data is now belatedly out… but it’s missing data:

Missing data again

At this stage it’s no longer possible to even trust our government’s count of how many people are dying.

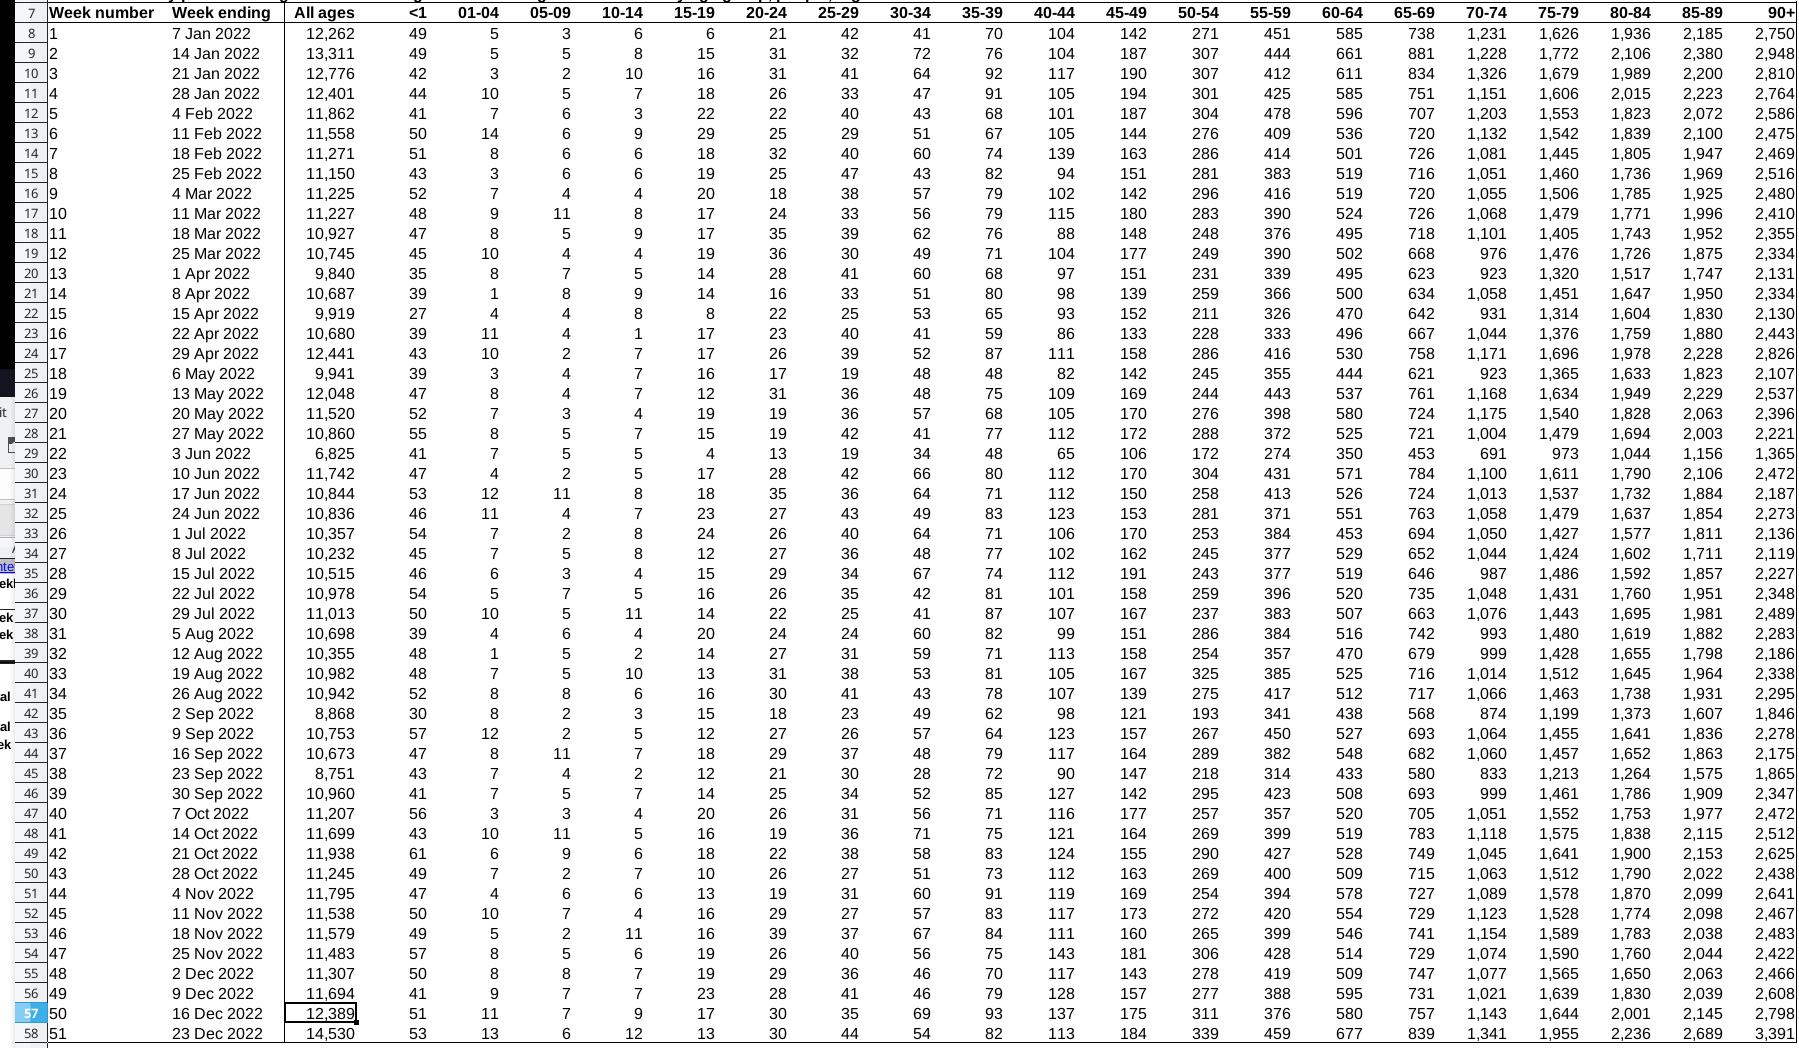
ONS: England and Wales Deaths in Week 51 (Xmas) Rose From 11.5K Before Pandemic to 14.5K in 2022 (26.4% Increase)

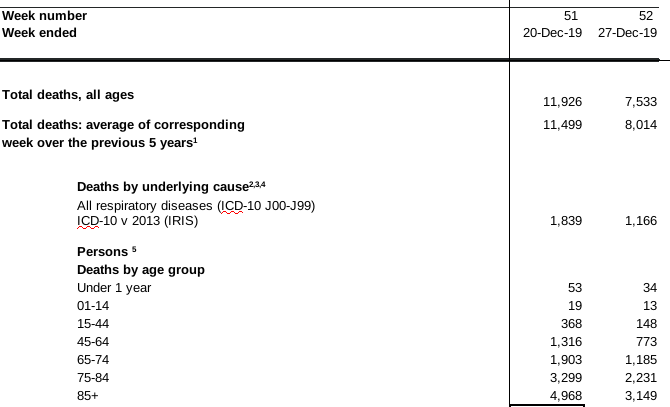
Their numbers are not reliable anymore, but here’s the data for week 51 (two weeks ago):

Xmas 2022 deaths

Compared to pre-pandemic levels:

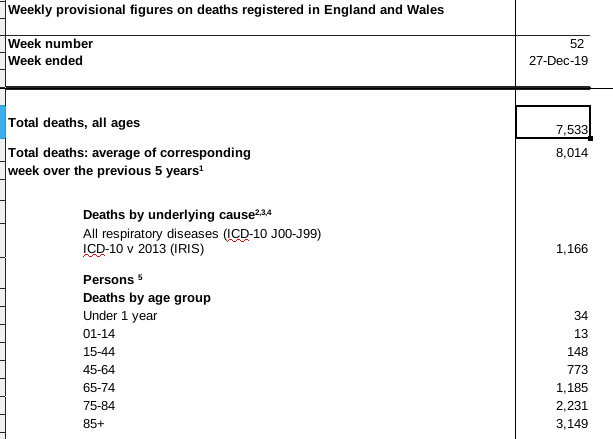
Cmas deaths in 2019

Xmas deaths, average for 2014-19: 11.5k
For 2022: 14.5k

But don’t worry, that’s just about 3,000 more dead people than before…. in one week! And nobody will notice, merry Xmas everyone!!

That’s 26.4% increase in deaths, but they tell us to quit worrying about the COVID-19 pandemic, side effects of vaccines (dare to suggest any exist and they’ll call you “antivaxer”), and the NHS crisis in general.

Deaths Soaring in Ireland After COVID-19 and Vaccination

Ireland stats

Data as OpenDocument Format

Back in October I looked at the data from Ireland for the first quarter of each year, focusing on total number of deaths, irrespective of cause and age.

We now have data for the second quarter (Q2) of this year.

Total number of deaths in second quarter (Q2), by year:

Q2 2019: 7519
Q2 2020: 8582
Q2 2021: 6700
Q2 2022: 9326

“It Is Estimated That Only 10% of Serious Reactions and Between 2 and 4% of Non-serious Reactions Are Reported.” (Follow-up)

Yellow card scheme, Don’t wait for someone else to report it

www.gov.uk/drug-safety-update/yellow-card-please-h…

It is estimated that only 10% of serious reactions and between 2 and 4% of non-serious reactions are reported.

Yellow card government site, just a click away

https://www.gov.uk/government/publications/coronavirus-covid-19-vaccine-adverse-reactions/coronavirus-vaccine-summary-of-yellow-card-reporting

As of 23 November 2022, (UK)

Pfizer/BioNTech, monovalent and bivalent

177,925 Yellow Cards have been reported

AstraZeneca

246,866 have been reported

Moderna, monovalent and bivalent

47,045 have been reported

Novavax

52 reports

Brand of vaccine was not specified

2,130 reports

Total reports

474,018

Overall reporting rate

Around 2 to 5 Yellow Cards per 1,000 doses administered

In the 28 days

Pfizer/BioNTech, + 2,499 reports

AstraZeneca, + 228

Moderna, + 1,099

Novavax, + 15

Brand not specified, + 154

For all COVID-19 vaccines

injection-site reactions (sore arm for example)

generalised symptoms such as ‘flu-like’ illness

headache, chills, fatigue (tiredness), nausea (feeling sick), fever, dizziness, weakness, aching muscles, rapid heartbeat

they may be reported more frequently in younger adults

Overall, our advice remains that the benefits of the vaccines outweigh the risks in the majority of people.

The benefits of the vaccines in preventing COVID-19 and serious complications associated with COVID-19 far outweigh any currently known side effects in the majority of patients.

https://wchh.onlinelibrary.wiley.com/doi/pdf/10.1002/psb.1789

Google YT guidelines

https://support.google.com/youtube/answer/9891785

Claims that an approved COVID-19 vaccine will cause death, infertility, miscarriage, autism, or contraction of other infectious diseases

https://www.gov.uk/government/publications/regulatory-approval-of-covid-19-vaccine-moderna/information-for-healthcare-professionals-on-covid-19-vaccine-moderna

4.4 Special warnings and precautions for use

Hypersensitivity and anaphylaxis
Anaphylaxis has been reported in individuals who have received Spikevax.

Close observation for at least 15 minutes is recommended following vaccination.

Myocarditis and pericarditis

There is an increased risk for myocarditis and pericarditis following vaccination with Spikevax.

Few days, primarily occurred within 14 days,

more often after the second dose,

more often in younger males

risk profile appears to be similar for the second and the third dose

Available data suggest that the course of myocarditis and pericarditis following vaccination is not different from myocarditis or pericarditis in general.

Healthcare professionals should be alert to the signs and symptoms of myocarditis and pericarditis.

Vaccinated individuals should be instructed to seek immediate medical attention if they develop symptoms indicative of myocarditis or pericarditis,

such as (acute or persisting) chest pain, shortness of breath or palpitations following vaccination.

Healthcare professionals should consult guidance and/or specialists to diagnose and treat this condition.

Who can get a COVID-19 vaccine

https://www.nhs.uk/conditions/coronavirus-covid-19/coronavirus-vaccination/coronavirus-vaccine/

Everyone aged 5 (on or before 31 August 2022) and over can get a 1st and 2nd dose of the COVID-19 vaccine.

People aged 16 and over, and some children aged 12 to 15, can also get a booster dose.
Hypertension after COVID-19 vaccination

https://pubmed.ncbi.nlm.nih.gov/34985455/

Italian research

Office for National Statistics Unable to Publish Statistics That Show Far More Deaths Than Usual

A “dog ate my homework” moment?

After much waiting, and maybe a dozen page refreshes*, we finally get this:

Over the Christmas period we will not be publishing Deaths registered weekly in England and Wales so the next publication will be available on the 5th of January and shall cover the weeks ending 16th and 23rd of December. Due to a processing issue, there has been an undercount of death occurrences in week ending 9th of December. Due to this the figures for week 49 will now be published in the next weekly mortality publication coming out on the 5th of January.

Are these numbers reliable?

Undercount of deaths

Can they blame Microsoft Excel? Either way, vigilant citizens are being left in the dark for about 3 weeks**. How hard can it be to just count death certificates (no classification needed)?

________
* I’ve been very eager to see these numbers. We see reports about COVID and hospitalisation surges.
** It’s hard not to feel like they may be ‘hiding’ the dead now (the totals at least). Delaying the information? We have a vaccine crisis, virus crisis, freezing wave etc.

Births in England and Wales Down 5.2% Since Pre-Pandemic Years, Baby Deaths Down by a Similar Level

Data for this article: Baby deaths [Open Document Format]

deaths-babies-pre-and-post-covid

Hypothesis: babies born into the pandemic are equally likely to survive (but caveats exist, e.g. maybe only more affluent families still have kids and medical treatments continue to improve)

So I’ve decided to check how the pandemic affects babies, specifically people under the age of 1 in England and Wales, for which we have complete data from ONS.

Based on the available data, 2,190 children under the age of 1 died so far this year, compared to 2,322 (132 more) in 2019. Those kids might be born a year earlier, i.e. in 2021 and in 2018.

Births in 2018 were 5.2% higher than in 2021, based on the official figures. 657,076 – 624,828 = 32,248 (fewer births in 2021 than in 2018), representing a big decrease.

Old data can be found here (births in England and Wales). It says: “There were 679,106 live births in England and Wales in 2017, a decrease of 2.5% from 2016 and the lowest number of live births since 2006.”

In 2018 there was a decrease. To quote: “There were 657,076 live births in England and Wales in 2018, a decrease of 3.2% since 2017 and a 9.9% decrease since the most recent peak in 2012.”

More recent data comes from this page (also see “Births by parents’ country of birth, England and Wales: 2021″). To quote: “There were 624,828 live births in England and Wales in 2021, an increase of 1.8% from 613,936 in 2020, but still below the 2019 figure (640,370); 2021 remains in line with the long-term trend of decreasing live births seen before the coronavirus (COVID-19) pandemic.”

It also says: “There were 2,597 stillbirths in 2021, an increase of 226 from 2020; this is similar to the 2,522 stillbirths in 2019. [..]. The stillbirth rate in 2021 increased to 4.1 stillbirths per 1,000 total births compared with 3.8 in 2020; this is also higher than the rate seen before the coronavirus pandemic in 2019 (3.9).”

Based on the available data, the number of babies dying in their first year was similar in the past year to what it was before the COVID-19 outbreak. If adjusted to the total number of births, compensating for disparity and assessing the ratio.

It may be safe to conclude that babies’ mortality rate (at least here) did not worsen in recent years, unlike all the other age groups.

Retrieval statistics: 21 queries taking a total of 0.097 seconds • Please report low bandwidth using the feedback form
Original styles created by Ian Main (all acknowledgements) • PHP scripts and styles later modified by Roy Schestowitz • Help yourself to a GPL'd copy
|— Proudly powered by W o r d P r e s s — based on a heavily-hacked version 1.2.1 (Mingus) installation —|