Introduction About Site Map

XML
RSS 2 Feed RSS 2 Feed
Navigation

Main Page | Blog Index

Archive for the ‘Research’ Category

Excess Deaths Very High in England and Wales This Year

The new data from ONS:

The new data from ONS

Let’s look at what happened before the pandemic:

2014-2019-deaths-by-week

Compared to this year (so far):

2022-deaths-by-week

We’re at almost 12,000 deaths per week. It was below 10,000 just a few years ago.

Data file: deaths by week (week 45) (ODF)

New Study on Vitamin D and COVID-19

Description:

Association between vitamin D supplementation and COVID-19 infection and mortality

https://www.nature.com/articles/s41598-022-24053-4

(12th November 2022)

Johns Hopkins
University of Michigan
National Bureau of Economic Research
Department of Medicine, University of Chicago
Department of Veterans Health Affairs
Department of Medicine, University of Chicago, Chicago

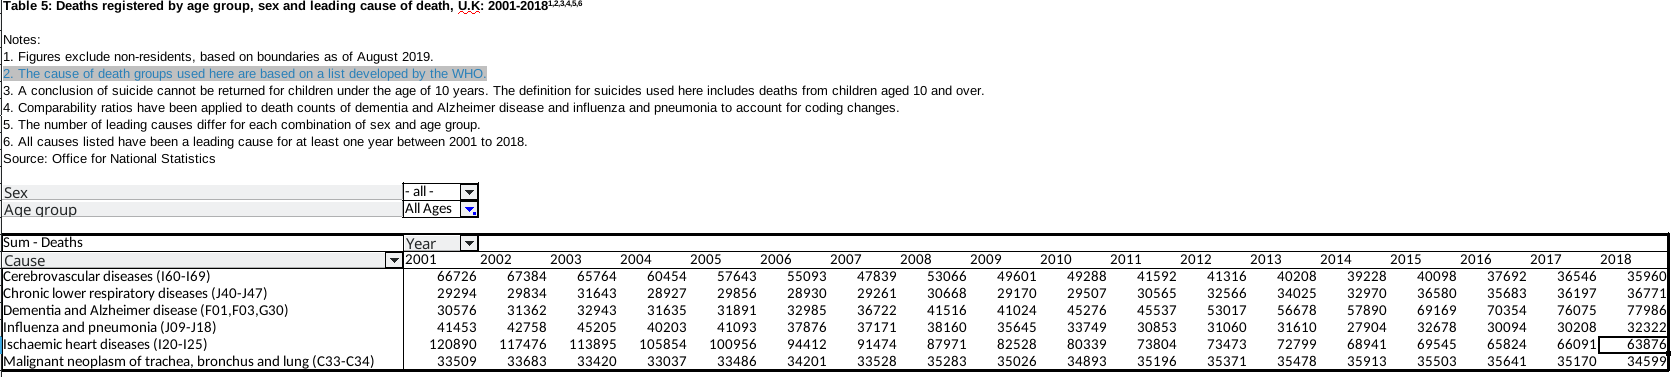
Vitamin D deficiency, associated with reduced immune function,

can lead to viral infection

Vitamin D deficiency, associated, increases the risk of COVID-19

But is it a treatment / prognosis improver?

Population of US veterans, we show that Vitamin D2 and D3 fills

Associated with reductions in COVID-19 infection

After applying all restrictions

220,265 supplemented with vitamin D3

34,710 supplemented with vitamin D2

407,860 untreated patients.

Study design

Retrospective cohort

Supplemented (before and during the pandemic),

versus untreated controls

One to one matches

D2, D3, or calcifediol

Veterans Administration Corporate Data Warehouse (CDW) electronic health records.

Vitamin D levels typically respond to treatment following two months of exposure

D3 cohort

COVID-19 rates for the treated = 2.66%

COVID-19 rates for the untreated = 3.30%

D3 20%, reduction

D2 28% reduction

Mortality within 30-days of COVID-19 infection

Infection ending in mortality within 30 days

D3 group

Treated group death rate after infection = 0.23%

Untreated group death rate after infection = 0.35%

Vitamin D3 33% mortality lower (HR, 67%)

P? less than ?0.001

Vitamin D2 25% lower (HR, 75%) (but not significant)

Veterans receiving higher dosages of Vitamin D obtained greater benefits from supplementation than veterans receiving lower dosages.

Vitamin D blood levels between 0 and 19 ng/ml,

exhibited the largest decrease in COVID-19 infection and mortality following supplementation

(0–19 ng/ml, 20–39 ng/ml, and 40?+?ng/ml)

Dosage options, 20 IU, 40 IU, 100 IU, 125 IU, 200 IU, 250 IU, 400 IU, 500 IU, 800 IU, 1000 IU, 2000 IU, 5000 IU, 8000 IU, and 50,000 IU

Black veterans received greater associated COVID-19 risk reductions, with supplementation than White veterans

As a safe, widely available, and affordable treatment, Vitamin D may help to reduce the severity of the COVID-19 pandemic.

More background

Vitamin D insufficiency and deficiency affect approximately half of the US population,

with increased rates in people with darker skin,

reduced sun exposure,

people living in higher latitudes in the winter,

nursing home residents,

and healthcare workers

Populations with low levels of Vitamin D have also experienced higher rates of COVID-19

New mechanism

Vitamin D is needed to allow T helper cells to control and reduce Interferon gamma (IFN-?) production

Conclusions

These associated reductions in risk are substantial and justify more significant exploration and confirmation using RCTs.

This is particularly important given the high rates of vitamin D deficiency in the US population and COVID-19.

Extrapolate, D3 supplementation to the entire US population in 2020

4 million fewer COVID-19 cases (19,860,000 actual cases)

116,000 deaths avoided (351,999 actual deaths)

Given our findings,

the absence of severe side effects,

the widespread availability of vitamin D3 at low cost,

vitamin D3 presents a unique opportunity to reduce the spread and severity of the COVID-19 pandemic.

K2, MK-7

Supplement, probably 100 micrograms per day

Nato, 1,000 micrograms per 100 g

Cheese, typically 50 micrograms per 100 g

Safe and effective

UK, GP incentives to vaccinate

Home, £30

Standard reimbursement to Primary Care Networks (which then gets passed to GPs) £15

New contract, £12.58 each

Lawrence

I have heard that Dr. John Campbell is in the pocket of Big Overhead Projector Lobby.

Rumour is that he has accepted tens of dollars of under the table expenses.

Anyone else notice that he always seems to have an endless supply of A4 paper and fountain pens?

England and Wales: Deaths Up 21% Compared to Pre-COVID-19 Levels, Based on Data Released Only Moments Ago

Minutes ago ONS released these new numbers, which I’ve been eager to see for days (also refreshed the page once in several minutes), having examined closely some troubling trends since the summer. Here’s the update:

Minutes ago ONS

We’ve made a local copy as OpenDocument Format (ODF).

For comparison’s sake, here are the latest numbers:

UK week 44 in 2022

Week 44 deaths in 2019:

Week 44 deaths in 2019

11795 (this year) – 9777 (pre-COVID 5-year average) = 2018 or 20.64%.

Office for National Statistics Makes It Hard to Demonstrate Increase in Heart Failures

As per these pre-pandemic numbers, the causes of death across the UK look like this:

Disease death range of years

This should be self-explanatory. The data is here as ODF.

2022′s breakdown by causes is framed rather differently, which makes comparison difficult (maybe intentionally).

2022 cause of death

The corresponding Web page does not specify totals per cause. The hypothesis here is that there’s a correlation between the increases in heart attacks or other cardiac events. Some are fatal.

An earlier report said that “leading cause of death in England in June 2022 was dementia and Alzheimer’s disease (10.8% of all deaths); in Wales, the leading cause was ischaemic heart diseases (10.7% of all deaths).”

So there’s somewhere around 11%. This is for June:

Cause of death in June

To quote some more:

In the first six months (January to June) of 2022, the leading cause of death in England was dementia and Alzheimer’s disease (107.7 deaths per 100,000 people). In Wales, the year-to-date leading cause of death was ischaemic heart diseases (116.8 deaths per 100,000 people).

In England, the year-to-date COVID-19 mortality rate decreased to the fifth leading cause of death (46.7 deaths per 100,000 people) from the third in May 2022. This was statistically significantly lower than the top two leading causes of death (dementia and Alzheimer’s disease, and ischaemic heart diseases), and significantly lower than four of the other seven leading causes.

In Wales, deaths due to ischaemic heart diseases, and dementia and Alzheimer’s disease were also the top two leading causes of deaths. They were statistically significantly higher than any other cause of death. Deaths due to COVID-19 decreased to the sixth leading cause of death in the year-to-date (46.9 deaths per 100,000 people), from fourth in May 2022. This was significantly higher than all leading causes ranked lower.

So about 1.17 in 1,000 people died with “leading cause of death [being] ischaemic heart diseases” in the first 6 months.

The tendency to release in such inconsistent presentation forms (or presenting different kinds of data) makes one wonder if the motivation is to hide something. Why should it be so hard to figure out how many people died annually from heart failure before and during the pandemic?

ONS: More Than 1 in 50 People in England Estimated to be COVID-19 Positive This Month

And here is the graph plotted based on this new data:

% of population testing positive for COVID-19

Over 13,000 Registered Deaths in the UK Per Week in Autumn (We’re Still Losing Almost as Many People as When COVID-19 Started)

IT IS hard to find mortality rates (pre-COVID-19) for the whole of the UK. The closest thing to it is this FOIA/FOI request or this month’s data file, which shows:

UK deaths based on ONS

The number on the right is total deaths per week (2022).

Looking at the FOIA, here’s what it says: “Using the Deaths registered weekly in England and Wales, provisional, as at week 46 (13th November 2020) 529,928 registered deaths in England and Wales.”

For the year prior: “In 2019, there were 530,841 deaths registered in England and Wales.”

Screenshot below included, as the page will vanish one day:

ONS FOIA

So far, in the first 43 weeks of 2022, in England, Wales, Scotland and Northern Ireland combined there have been 536,196 deaths (I’ve put together the numbers).

We’re seeing about 13,000 deaths per week, so expect 40,000 more in the 3 weeks that follow, i.e. about 575,000 deaths.

In the above FOIA, ONS does not give the complete figures for the whole of the UK (those are hard to find, maybe by intention), but using this weekly update we get for England and Wales:

471,064. With 9 more weeks ahead (for the year to finish). 3 more weeks from now it’ll be about 502,000 compared to 529,928 at the same period in 2020.

wales-england-deaths

Extrapolate a little and find that in 2022 we’re not doing a lot better (than in 2020) in terms of preventing deaths.

Latest Data Supplied by ONS, as OpenDocument Format (Not Microsoft’s Proprietary Formats)

Curious that this awful news was published exactly on memorial day.

Work crisis based on ONS
Work/labour crisis based on ONS (many people in working age are unable to work for health reasons; many more than usual die, too).

Just over a day ago ONS issued this report. It shows a health crisis. Tragic that ONS uses proprietary Microsoft formats as the sole option in some cases. Here is the net increase in people out of work due to sickness (those are not very old people). To quote: “More people are out of the labour market because of long-term sickness since the pandemic began, but long COVID is not the main factor” (so what is it?)

Mar-17 0 (baseline)
Apr-17 -12243
May-17 3062
Jun-17 -9687
Jul-17 15880
Aug-17 31964
Sep-17 63498
Oct-17 41252
Nov-17 -8983
Dec-17 5493
Jan-18 -4207
Feb-18 -7468
Mar-18 -14159
Apr-18 -5663
May-18 13248
Jun-18 51386
Jul-18 58023
Aug-18 40517
Sep-18 8515
Oct-18 -8724
Nov-18 476
Dec-18 15675
Jan-19 14694
Feb-19 -12721
Mar-19 10836
Apr-19 -20433
May-19 25155
Jun-19 40168
Jul-19 56703
Aug-19 77710
Sep-19 62523
Oct-19 80378
Nov-19 73738
Dec-19 83506
Jan-20 128347
Feb-20 120961
Mar-20 136072
Apr-20 157124
May-20 135137
Jun-20 131716
Jul-20 156974
Aug-20 185190
Sep-20 228936
Oct-20 226929
Nov-20 203011
Dec-20 241629
Jan-21 212563
Feb-21 188448
Mar-21 216830
Apr-21 205674
May-21 221870
Jun-21 190969
Jul-21 230382
Aug-21 270572
Sep-21 295908
Oct-21 303054
Nov-21 348557
Dec-21 335703
Jan-22 344846
Feb-22 358585
Mar-22 323858
Apr-22 346058
May-22 329616
Jun-22 394814
Jul-22 472972
Aug-22 498642

What has happened since then? It must have worsened a lot.

Seeing that all the data is in Microsoft formats (shame on ONS for outsourcing a lot to Microsoft, rewarding Microsoft for crimes), I’ve decided to convert it to ODF, as follows:

Retrieval statistics: 21 queries taking a total of 0.191 seconds • Please report low bandwidth using the feedback form
Original styles created by Ian Main (all acknowledgements) • PHP scripts and styles later modified by Roy Schestowitz • Help yourself to a GPL'd copy
|— Proudly powered by W o r d P r e s s — based on a heavily-hacked version 1.2.1 (Mingus) installation —|