Introduction About Site Map

XML
RSS 2 Feed RSS 2 Feed
Navigation

Main Page | Blog Index

Archive for the ‘Research’ Category

‘COVID Effect’: Almost 20% Increase in England and Wales Deaths in Latest Week’s Data From Office for National Statistics (ONS)

Comparing pre-COVID years to 2022 mortality levels

Some new numbers were published just over a day ago:

ONS report

To quote the summary: “In the week ending 7 October 2022 (Week 40), 11,207 deaths were registered in England and Wales; 400 of these deaths mentioned “novel coronavirus (COVID-19)”, accounting for 3.6% of all deaths.”

But how many of them were COVID survivors just ‘limping along’ and dying later without that counting as COVID-19 linked?

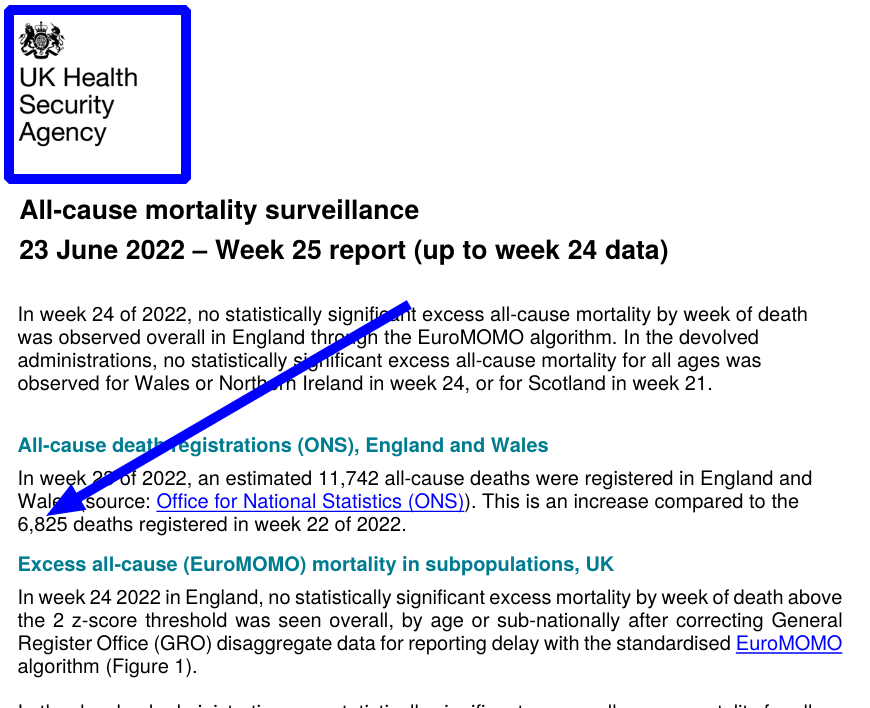
Further down it says: “The number of deaths registered in the UK in the week ending 7 October 2022 (Week 40) was 12,793, which was 13.7% above the five-year average (1,538 excess deaths); of these deaths, 449 involved COVID-19, which was 106 more than in Week 39.”

But this 5-year average includes 3 years of COVID-19 (this year, 2021, and 2020), so let’s go back in time and see pre-COVID death rates for this wee.

In 2019 week 40 had 9,799 deaths and the 5-year average was 9,450. See screenshot (we already uploaded the original report as ODF):

Deaths 2019 in England and Wales

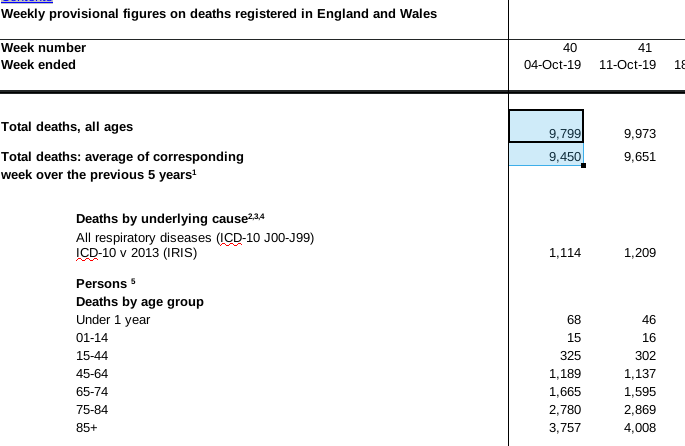
11,207 – 9,450 = 1757.

So for this week alone, for England and Wales alone, we’re 1757 higher than the 5-year average of pre-COVID levels.

1757 is almost 19% of 9,450, so we’re taking about an increase of almost 20% of this week.

CDC Data: Mortality Rates in the United States by Age Groups (2017-2020)

Mortality in the United States, 2018, fig3

Mortality in the United States, 2020, fig3

Personal observation: in my age group the death rate exploded by 25%. In just one year! Based on more recent data (with no age group separation), 2022 is no better than 2020.

References

NOTE: There is no similar study later than the above. See the date below.

CDC on mortality

Related: CDC Data: US Deaths About 25% Higher This Winter Than Last Winter Before COVID-19 (Updated)

4 Months Later, Office for National Statistics (ONS) Data on England and Wales Deaths Remains Uncorrected

It could not possibly be this low. Where are those missing deaths? Dispersed across other weeks? Lost in Microsoft Excel? Undated? The documents shown here do not say (week 25 and week 24).

This is statistically impossible (HSA cites ONS)

ONS missing data

The original from ONS:

ONS data

Not corrected a week later:

HSA numbers missing

Now in October there is still no correction of those figures.

Ireland’s Death (Mortality) Data: Deaths Not Slowing Down Since Pandemic’s Peak, Totals Still 11% Higher Than Pre-Pandemic

Ireland's death data

UPLOADED and shown at the bottom are the raw, official, unaltered datasets. All I changed was the format to make it an open standard. The data is from this official portal, last Updated: 24/08/2022 (see screenshot above).

We now have Q1 data for this year (nothing later than this has been made publicly available yet), so we can compare apples to apples.

2017 Q1: 9067
2018 Q1: 9278
2019 Q1: 8618
2020 Q1: 8674
2021 Q1: 9564
2022 Q1: 9535

That’s 917 more (this year) deaths than in 2019 (pre-pandemic) or 10.6% higher.

And here’s all the data as ODF files:

This is consistent with what we see in the UK. In the US it’s a lot worse.

How Social Control Media Blocked, Suppressed, and Defamed Medical Journals That Issued Legitimate Warnings

Published a few hours ago:

Of relevance:

World’s Leading Medical Journal (The Lancet) Slams Bill Gates for Supporting Tobacco Industry

Later:

Gates Foundation Pays the Lancet Journal — Now Distorts Academic Literature Too

Sharp Increase in England and Wales Deaths in 2022

Video download link | md5sum 5ba19e929c74a3510a3095eeb0569f9c
Sharp Increase in England-Wales Deaths
Creative Commons Attribution-No Derivative Works 4.0

THE video above explains my couple of blog posts prepared about COVID-19 today [1, 2]. It explains that deaths have sharply increased this year it’s not clear how to identify/explain the cause, only that there is a cause or causes.

ONS Data: Working Age Adults See 10% Rise in Mortality Between 2019 (Pre-COVID-19, January-September) and 2022 (Year to Present)

JUST to be clear, I wish to state upfront this post does not blame vaccines for anything. There are many different factors to consider, but the net effect is that a lot more people are dying than before. It’s like 10 times higher than the rate of population growth.

We’ve only just published (as ODF) sets of mortality figures from England and Wales. Here they are.

I’ve done some further analysis of the numbers, which I will revisit as more (newer) data comes in. Some will become available tomorrow, as noted before (“England and Wales Summertime Deaths in 2020 versus 2022 (Spoiler: About 1,500 More Deaths Registered Per Week in 2022″).

It’s widely known and generally recognised that COVID-19 mostly kills very old people, irrespective of gender and race (those factors play a role, but age is the most common factor).

So how many people died before and after COVID-19 infections, vaccinations, and lock-downs?

I’ve studied the data carefully and found that in January till mid September, for ages 15-44, the total deaths were:

10,404 in 2019
11,384 in 2022

For ages 45-64: (much higher risk group)

45,296 in 2019
49,424 in 2022

The cutoff I’ve chosen for September is me being GENEROUS in FAVOUR of 2022 (i.e. making the numbers in 2022 look smaller for the analogous period), so assuming the numbers published were daily rather than weekly it would be about 10% difference for both age ranges.

These numbers are very big and death is not “subjective”, so the statistical dataset is of high quality.

I’ve intentionally left out 2020 and 2021 because of massive spikes in deaths. If the number of deaths is about 10% higher after 2021 (compared to before 2020) and government statistics say those deaths in 20222 are barely due to COVID-19, then something else is killing a lot more working age adults than before. To say that COVID-19 is no longer a pandemic is truly insane. We’ve not solved the problem. 6,000 more people cannot reach their pension age (and that’s just for January-September). So it’s not only an “old people’s problem”.

Retrieval statistics: 21 queries taking a total of 0.318 seconds • Please report low bandwidth using the feedback form
Original styles created by Ian Main (all acknowledgements) • PHP scripts and styles later modified by Roy Schestowitz • Help yourself to a GPL'd copy
|— Proudly powered by W o r d P r e s s — based on a heavily-hacked version 1.2.1 (Mingus) installation —|