Introduction About Site Map

XML
RSS 2 Feed RSS 2 Feed
Navigation

Main Page | Blog Index

Archive for the ‘Research’ Category

Running Experiments Over SSH

BAD habits die hard. Good habits stay, so over time we do things more effectively. Today’s post may be relevant to post-doctoral folks whose work involves a lot of computation, including over-night or multi-day experiments.

6 or 7 years ago I wrote detailed posts about how I was using KDE to run experiments on entire clusters of Fedora boxes, over SSH. It has been a long time since then and nowadays, rather than use many dual-core boxes I just mostly use a pair of 8-core computational servers. The tricks are mostly the same and the scripts are largely reused from those that I wrote around 2004 (they are publicly available in this Web site). The procedures are mostly the same, but technically, a few things have changed and this post will detail them (aside from that, back then I did my Ph.D. and now I get paid to run these experiments).

In case of network issues, it is important to run everything but the computation locally. This means that code editing, for example, should be done locally. This reduces cursor/menu lag and prevents loss of work in case of loss of connection. It also assures that files get written to more than one place (local plus remote). Kate with KIO (in Kate) use slaves to enable editing of files over SFTP or SCP/SSH, so this functionality ought to be exploited for controlling experiments remotely. For other tasks, separate terminal windows (e.g. Konsole) should be opened, preferably with endless scrolling buffer, for each remote machine. GUIs can be created to enable quick adjustment and running of experiments. A good terminal will stay active and visible even when a remote connection gets closed, in which case, results can still be observed. In addition, it may help to have another terminal window connected to each remote machine in order to track load throughout runtime, as well as other things (one busy session may permit nothing else to be done on the same terminal). Here it is illustrated graphically, based on screenshots just taken.

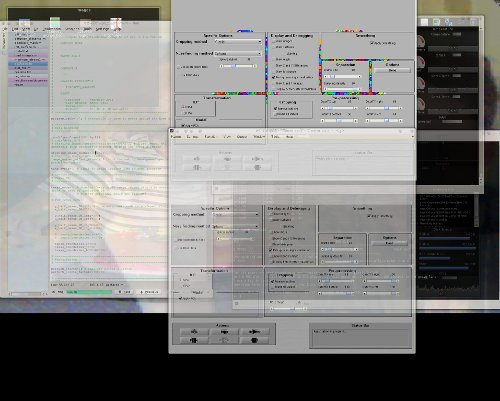
Full screen view on workspace 8 (research):

Full screen

Let’s break it down into the left and right monitors:

Full screen left

This left side of the dual-head display contains the tabbed-style view of program files that need editing. All those files are using KIO to essentially be seen as local even though editing them modifies them on the remote servers that I connect to (see terminals on the right). In addition, I used Java framework to create a GUI front end for the experiments. It is singleton for each server.

On the other screen I have this:

Full screen right

Shown at the top left is a window that’s invoked by the program when results are ready. By using KDE’s window-specific settings I can force all such windows to always open in workspace 8 (research), so even if I am busy with other tasks the windows will quietly show up where it belongs, sometimes along with dozen other windows that need attention later. On the right side there are terminals connected to the computational servers. One currently gets used to rsync the code across across servers and the other is tracking server loads.

So, this is pretty much how I use workspace 8. I previously explained how I use workspace 2 (there are 12 in total). KDE makes it easy to multi-task without getting distracted.

Activism and Legacy

LEGACY of one’s life may typically matter to a person when death is near. That’s partly because last/recent memories persist better than old ones. Legacy is also what remains in visibility after a person departs from this world, having first emerged in it through conception. But legacy need not be associated with depressing things such as being deceased. Legacy throughout one’s life can be seen as the work that’s left to have impact when one moves from one area to another, from one field of work to another.

In older terms, publications and books were seen as a form of legacy. In a digital world the importance of these becomes more questionable and long-term persistence almost dubious. Work that is done in the disciplines of science and technology may matter a lot at the time of publication/invention, but only years later that work becomes uninteresting due to irrelevance. There are of course exceptions such as key, landmark papers (Charles Darwin’s for example) and immortal series such as Cosmos, but the vast body of work will only have its 15 minutes or fame — if any — and thereafter be shelved.

Activism is different in the sense that it has broader impact due to scale of reach (like target audience). Those who fought SOPA, for example, achieved a great deal and did this not for profit but for ideology.

In my younger days as a researcher I strived to publish papers and had my name put on half a dozen of them around 2005 when I was completing practical work on my Ph.D. In early 2006 I stopped submitting papers and also ceased to attend conferences. These had low impact compared to my sites, their target audience was small (mostly departments in the same field as mine), and the sense of accomplishment was not high. It was then that I turned to activism and spent the majority of my day dedicating energy/effort to good causes, even if it comes at the expense of a paying job. There have been no regrets, except perhaps regrets that I had not started doing this sooner.

The life of an activist is a lot richer than the life of a compulsive businessman. Richness cannot be properly measured in terms of monetary currency and some people are so poor that all they have is a high bank balance. Over the long run, history teaches, activists have a memorable legacy; the latter have not.

Increase in Number of Points in GMDS for Classification Purposes

GMDS for surface pairs comparison

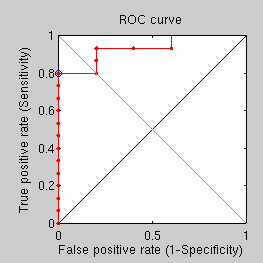
AS natural succession to the previous experiments, I compromise speed and increase the number of points in GMDS from 10 to 50, hoping to see performance improved noticeably. So far, based on results that are coming out, no classification mistakes are being made, but more pairs need to be tested overnight before meaningful conclusions can be drawn.
As expected, increasing the number of points in GMDS helped improve performance, at the expense of speed of course.

They will now be increased even further to see how good an improvement can be made.

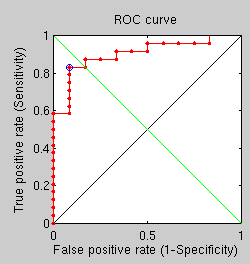
I have begun running GMDS-based recognition experiments with 300 points rather than the originally/already-tested 50. So far, based on 18 pairs, the classification is perfect (albeit the process is slow). It will be interesting to see how long it runs before the first error occurs. There was a talk back in December about a new server potentially arriving, with a lot more x86 cores in it.

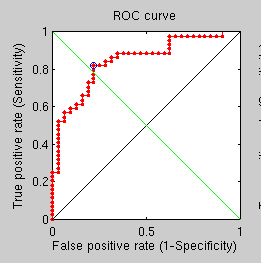
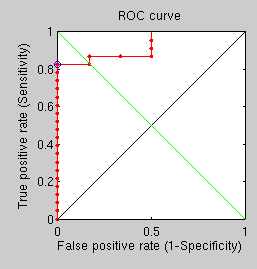
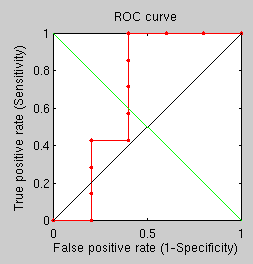
Following the first mistake of the classifier, the ROC curve looks like this.

The next step doubles the density of the triangulation to see how major an improvement in performance it can entail (we never tried as many as 8,000+ vertices in such experiments).

With ~8,050 vertices the results are a bit baffling. Both computational servers got rebooted midway (memory upgrade), so there is not much data — to say the least — to base these results on.

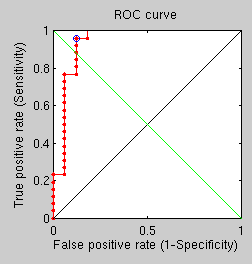
By summing up all the GMDS stress (multiple iterations) we get iffy results.

By taking the optimal fit (over all iterations) we get something better.

In summary, despite the small size of the sample, it does seem to suggest that using a triangulation too dense leads to poor results or does not lead to optimal performance. I’ll explore other route towards improvement; adding density just slows things down considerably.

GMDS-based Surface Matching After Alignment, Masking

FOLLOWING this previous shoutout I was speaking to a colleague about a more reliable way of comparing two triangulated surfaces as it is required once the masking gets done and good alignment is attained.

I spent some time searching around the Web to see if someone made a robust and accurate way of doing so, rather than rely on ad hoc methods that I wrote on my own. The triangles already are reduced for analogous regions to overlap, but comparing on this basis (in 3-D) needs some cunning theory to be robust to slight changes in expression. MathWorks’ File Exchange hardly provides anything for this purpose. I looked through hundreds of submissions. There is a paper titled “Surface Matching: geodesic distance evolution PDEs on manifolds” and it links to http://www.cs.cmu.edu/~3dvision/meshtoolbox/executables.html. The page is no longer there, but there is a new working URL for it. “Overlap” is the tool closest to what we need (but not quite the best for the job). The comparison we do is not a topological one but one that should be sensitive to small localised anomalies, with just 4,000 (at most, for technical limitation in FMM) triangles. To get to the very high 90s in terms of matching rates (%-wise) I could use some advice/pointers. I have been reading “Geodesic Matching of Triangulated Surfaces”. It is a paper from A. Ben Hamza and Hamid Krim (North Carolina State University) and it demonstrates the use of Jensen-Shannon dissimilarity results. Wang et al. in “3D Brain surface matching based on geodesics and local geometry” seemed interesting and relevant. This paper, however, does not deal with surface-to-surface comparison of brains but with other problems. After a while it was time to explore older methods.

We experimented a lot with GMDS back in July until a few months later. It did not give sufficiently good results for two main reasons: 1) the separability in terms of scores was not good enough and 2) GMDS did not always find the correct correspondences, perhaps due to initialisation issues and other factors. GMDS gave recognition rates higher than 90%, but this baseline was surpassed by the newer implementation. As GMDS is a refinement mechanism, it would be useful to see what would happen if we iterate (i.e. re-run it after some other way of aligning the surfaces). I decided to give that a go.

The results so far look so-and-so, with more false pairs being run to smoothen the curve and draw better conclusions. I am merely presenting the results, irrespective of their quality, just the quality of the experiments used to arrive at them. What’s measured in this case is the best fit stress (best among all iterations), which means that the rest get altogether discarded. ~4000 triangles are used for FMM in this case.

Running further experiments to account for more example pairs has done little to actually contribute to optimism, so I will explore another approach in iterating over the set with GMDS (run overnight).

Taking the average GMDS score rather than the best fit (minimum) score leads to results that are not better. These results are significantly inferior to those attaind through the older FMM-based method.

Important enough to mention was the fact that in the aforementioned experiments — those with GMDS iterations — only the area around the nose was factored in because it surrounds the landmark point which can most accurately be determined. Experiments from last year, however, systematically showed superior performance when an estimation of eye locations form the basis for an expanded mask, so additional experiments will now be run with the expectation that they will show improved recognition performance (hopefully around 95% correct).

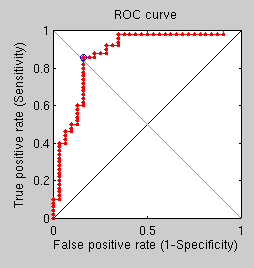
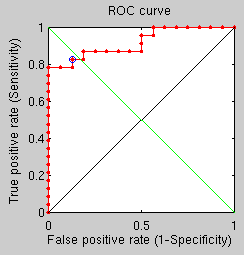
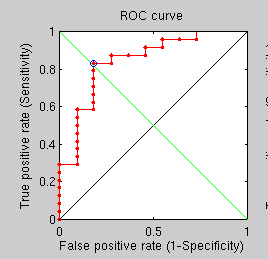
Several more experiments have been run to explore the use of GMDS in a supposedly more robust way to establish when an image pair comprises corresponding people. Starting with experiments that look at the use of 3 GMDS processes around 3 different centres, there is a best fit approach, from which the following ROC curve was obtained.

The same for average reveals similar performance.

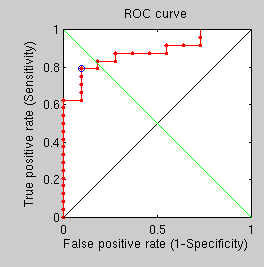
By taking all centre points at once and performing GMDS on a mask around that we get the third ROC curve.

he same for average shows performance lagging considerably (in comparison with results from another approach).

It is a lot worse than the ~97% recognition rates we got some months ago, Time to step back and rethink perhaps.

Geometry Gurus Needed (First Order Geodesics on Surface Pairs)

I COULD really use the advice of some people who are interested in computer graphics and vision — inverse but complementary fields, which are largely related to geometry and mathematics at large. The challenge is to compare surfaces based on their 3-D characteristics, using Euclidean, geodesic or another non-Euclidean metrics.

Here is what the surfaces look like.

Subject surfaces

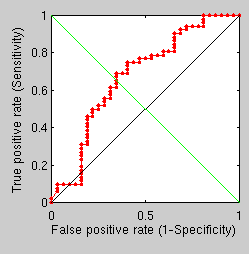
The following image represents a performance ROC curve we have.

ROC curve dilation approach

In simple terms, this means that we’re able to classify correctly about 70% of the time. Having summarised a year’s work, culminating in mostly unsuccessful experiments around diffusion (around 97^ recognition rate, the above is poor, So I return to working with geodesic distances as the Swiss army knife for measurement of distances. But the approach being explored at the moment is different and with further enhancement it can hopefully yield performance higher than 97% (matching rate). The sources of limitation are generally well understood in the sense that they can be visualised and overlaid on top of the image pairs. There is no trivial and reliable way to establish multiple landmark points around which to measure distances consistently, so I am trying another way, which at a very coarse level has a matching rate of about 80% (can be significantly improved soon).

The approach attempted at this stage involves triangle comparison post- and pre-marking, but the performance attained so far is not satisfactory.

The limitation is likely inherent in the measuring of distances in FMM and the sub-sampling that results from triangulation (see image for the size of triangles to be fully appreciated).

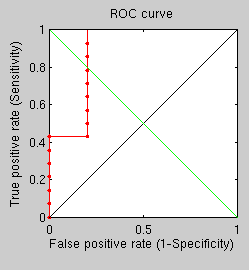
One particular weakness of the diffusion approach to masking is that it leads to holes in the data, which invalidates some of the measures that were used routinely beforehand. In order to fuse together both geodesic and spectral measures, we now attempt to get a more symbiotic approach that carves out surfaces based on geodesic properties and then uses spectral features on these surfaces. Since ordering does not exist (e.g. point-to-point correspondences), the histogram of images is used to describe the sub-surfaces (carved out around a known correspondence). By increasing the number of rings and bins in the histogram, the performance can be varied somewhat. I was running overnight experiment to test this and got some other appalling ROC curves, such as this:

Curve dilation approach with more rings

The results from the last experiment were disappointing because they did not provide good separability. So the following morning I designed and started running an experiment that explores the potential of measuring diffusion distance between furthest points in the surface carved in accordance with geodesic boundaries (several rings). This too did not give good results. Generally speaking, diffusion distance as a measurement has not proven to be anywhere as useful as FMM so far (since December). It seems to be insensitive to small differences and it does not seem to degrade linearly, either. The next experimental design will explore another new approach, perhaps conceding the potential of diffusion being integrated into the framework’s pipeline.

So the question is this: given two surfaces that are geodetically craves around the surface, what approach would you use to compare them for similarity? We’ve tried a variety of known methods, but none seems to yield very encouraging results thus far. Thanks for any advice or pointers you may have.

Longest Document I’ve Ever Published

With recent milestones reached and a change in publication strategy, I decided to unleash some easy-to-run code along with the 535 pages which document the code as well as experiments that have been run using this code over the past year or so. The document is not as organised as it ought to be, but I hereby make a lot of stuff available in fairly raw form. I made an HTML version to overcome file size issues that are associated with PDF, not to mention accessibility issues.

Surface Matching With Statistics and Geometry: Technical Report for 2011 (PDF – 535 pages, HTML – multi-page layout)

In summary, performance verging state-of-the-art is reached. In order to pile up and share the approach/work done thus far (before proceeding with the exploratory direction of diffusion/other), these are hastily-assembled notes that weigh 60 MB (over 500 pages for this document) which contain a lot of material that can prove useful some time along the way. Here is a previous post with some shorter documents. They are all being uploaded as HTML and PDF once they become coherent enough, soon to be indexed and made accessible through the research page and Web search as well.

Research Posts to Resume Soon

LAST year (or at the end of 2010 to be more accurate) I started posting a lot more often about my work in this blog. I resumed what I had done years beforehand, even if that meant a loss of focus for this personal blog. But then again, this blog hardly ever had any single point of focus, so after the upcoming release of one gigantic PDF I will resume posting updates about my research on a more regular basis. This ought to achieve a more transparent communication of ideas. It is also a departure from the disappointing pace of blogging (about a post per week as of late).

Retrieval statistics: 21 queries taking a total of 0.105 seconds • Please report low bandwidth using the feedback form
Original styles created by Ian Main (all acknowledgements) • PHP scripts and styles later modified by Roy Schestowitz • Help yourself to a GPL'd copy
|— Proudly powered by W o r d P r e s s — based on a heavily-hacked version 1.2.1 (Mingus) installation —|