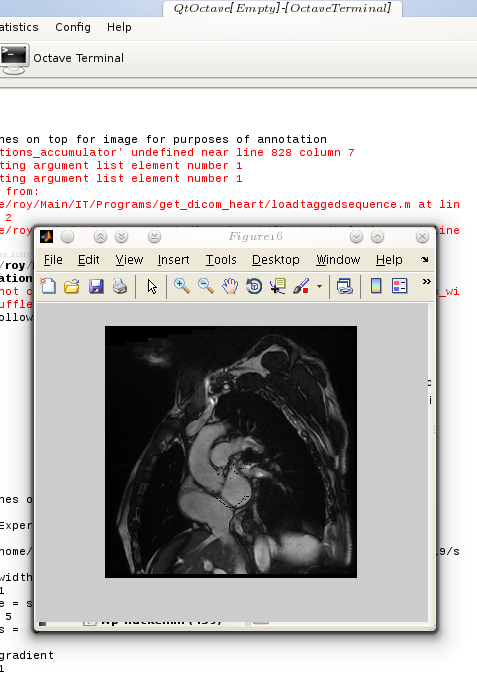
QtOctave on Kubuntu with a
MATLAB window imported from Fedora over SSH
 or the sake of cross-application/framework compatibility, one occasionally needs to alter code until it works everywhere, without the need to keep two (or more) separate codebases. This situation is far from ideal, but then again, not everything works like Java. When colleagues use a different platform and occasionally prefer proprietary software it is only fair to do some extra work catering for it.
In a matter of days or maybe a few weeks I will have some new code ready for release. I had already released this before it was ready for stable usage, partly because I had not set up a proper repository, so each release of code become a manual process. This may change soon.
In the early part of the day I ensured my programs work in both MATLAB and Octave. It was not as trivial as I had expected because there is certain functionality in Octave which MATLAB simply does not support. There are notes that I took to summarise and thus simplify this task in the future. The code now works in the latest MATLAB and also in Octave, with very minor differences between these two. The same set of files can be used for both, interchangeably.
Over the course of my work I have organised the data, documentation, experimental results, and code. All of these can be neatly packaged to provide the tools necessary for others to extend the program and use it to run more experiments. Following a very thorough survey of programs that are already available around the Web, it does not appear as though opportunities to reuse code were missed. At the moment, the program has an interface function with clearly-defined inputs and its output — in the form of images and video — is sent to a directory of choice at the end.
What would be nice to attempt next is implementation of other methods that assess similarity between regions, as means of selecting points more accurately. Making the placement of points diffeomorphic so that nothing gets folded or torn between the connecting curves that make up the contours would be essential too, especially for visualisation and 3-D reconstruction for example. At the moment it is possible to take point positions at each slice and each of the 20 iterations contained for that slice and then produce — using polygons — a sort of 3-D model of the heart. This, however, would require results to be of higher precision too.


 Filed under:
  T HAS been a while since the last post about an ongoing port from Octave to MATLAB (not a major challenge, ensuing compatibility being the goal) and also since the last episode of TechBytes. I work hard this weekend finishing and finalising (with GUI) my work on an existing project before proceeding to the next, which will deal with 3-D face recognition.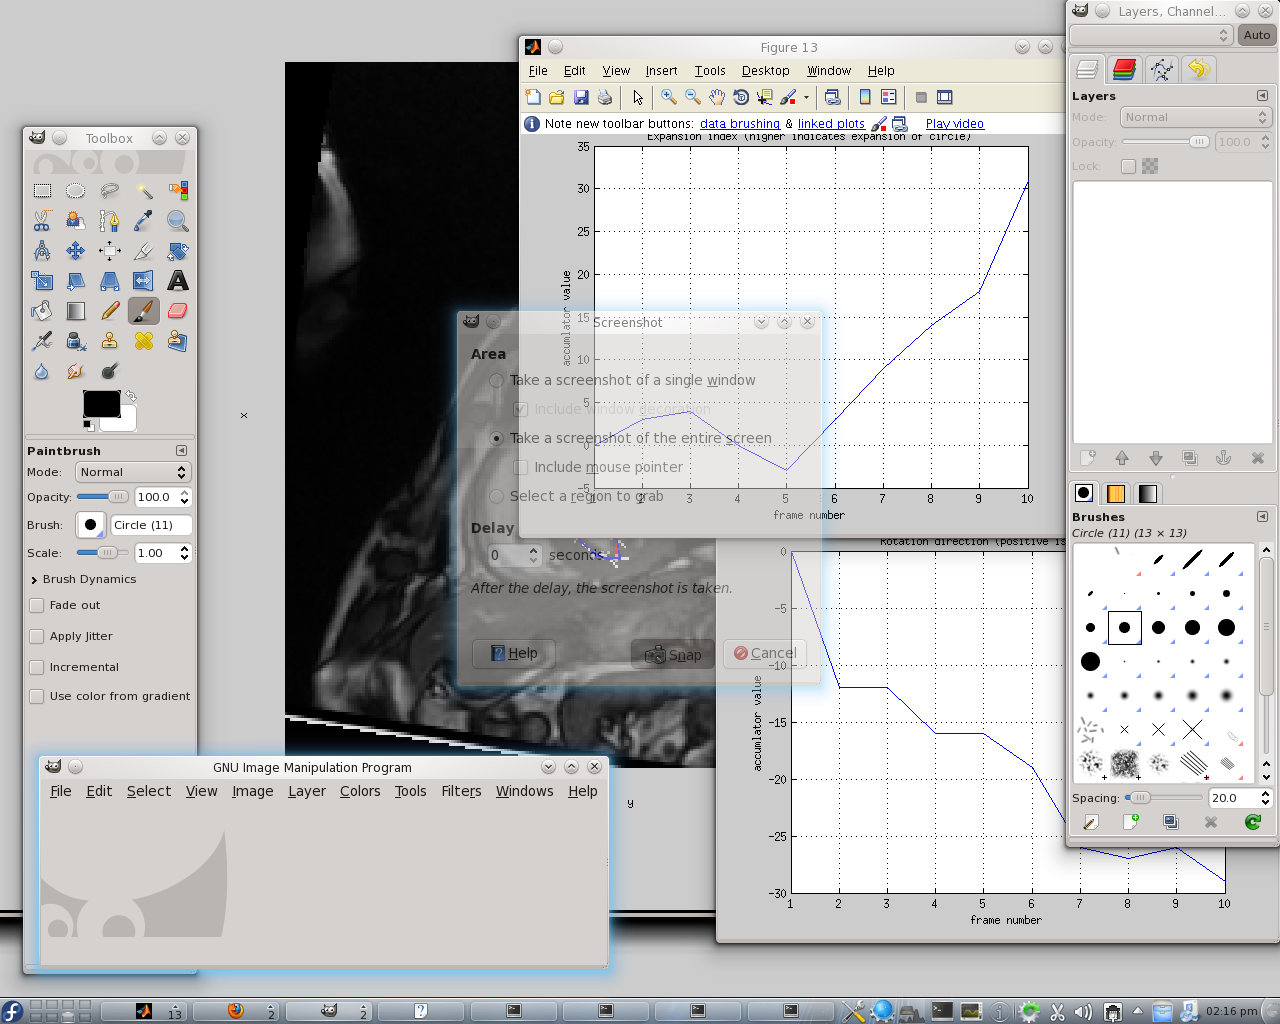


 ESTERDAY I encountered my first major setback in Octave for Kubuntu. It was a bug, not a missing feature. It involved an outside library again. I tried installing a newer version of gnuplot (installing the latest one by compiling the source code), but this did not resolve the issue. All in all, over an hour was spent on it, first assuming that I was coding wrongly and later realising that


 We hope you will join us for future shows and
 FEW DAYS ago I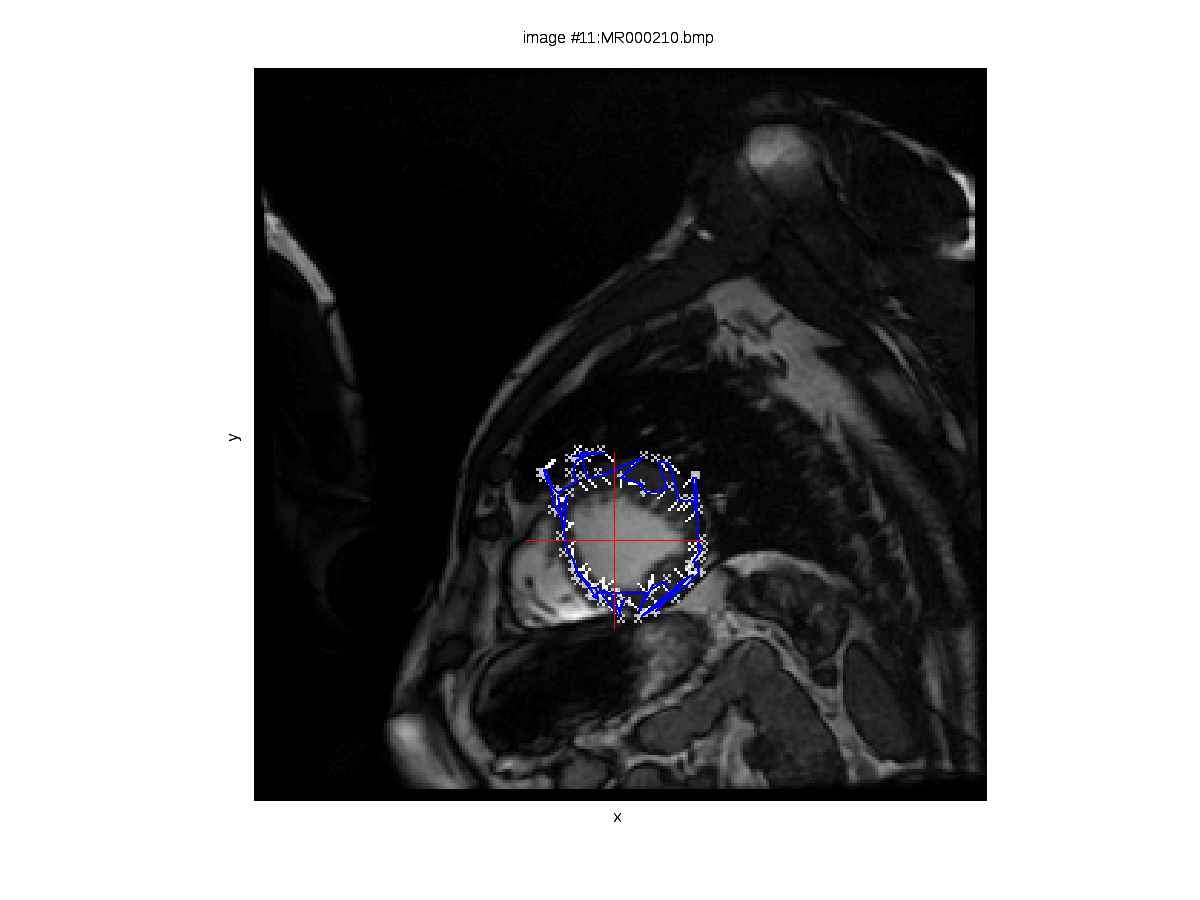
 hown here are two images derived from experiments out of which there are also videos. The set of cardiac images contains 340 images, divided into 17 groups of 20 images belonging to each. A group of 20 consecutive images represents one slice imaged throughout one cardiac cycle. This means that from the 2nd and 4th slides — images 21 and 61 respectively for example — the signal is approximately correspondent and thus can be compared. A series of experiments was performed in turn, dealing with each slice in isolation and learning how our algorithm copes with the complicated task of tracking the heart’s walls without a priori knowledge such as a model of the heart, for example (a model whose parameter values can be optimised over, for a good fit to be eventually found). We are interested in the rotation of the heart at the different vertical levels, particularly because we expect to see clockwise and counterclockwise movements throughout the cycle, depending on the slice (the heart squeezes blood by moving in different — almost opposite — directions).

 HIS fourth video in tonight’s series looks more closely at some of the different components of QtOctave.