


Tuesday, January 11th, 2011, 10:23 am
Heart Tracking With Fusion of Edge Detection Maps
 Filed under:
  currently put the final touches on my program which detects and analyses the movement of the heart using the fiesta protocol in an MRI-type modality (1.5 Tesla).
Recent and very simplistic experiments, where two rather distinct images were taken from the set and then rotated, were used such that the only real and anatomical shift is a rigid, geometric one. Two sorts of transformations were used; firstly, in two cases the images were rotated about the middle and in one case the rotation was around one of the corners. This gave different types of variations and various parameters were changes until the algorithm was able to track the points (placed at the edges) rather well. There are now new parameters in place, e.g. (in this case):
threshold = 1
transform_type = sum
frame_size = 2
shuffle_radius = 1
draw_grid =  0
arrow_type = gradient
verbosity = 1
output_type = image
draw_circles = 1
triagulate = 1
measure_tangent_component = 1
search_along_gradient = 1
gradient_search_range = 2
boundaries_line_width =  2
...
Going under the suffix “mid” (slice 3 from the bottom) we have an example of how the landmark points get moved between the frames.

Initial frame

Initial frame with landmark points on

Initial frame with connected landmark points

Position of landmark points at the end of the tracking sequence
Looking at edge detectors we have the possibility of fusion for improved tracking — with a two-tier image, one for the derivative and another being the original.

Sample image

Sobel edge detection of the image

Prewitt edge detection of the image
As an engine, I am currently using MATLAB for reasons of succession (other users of the program I built are less likely to run it in Octave like I do), but I don’t touch the MATLAB ‘desktop’, just the bash shell and vi as the editor (ncurses).



 Today’s show ends with the special track for TechBytes, courtesy of Marti who can be reached via
 ESTERDAY I encountered my first major setback in Octave for Kubuntu. It was a bug, not a missing feature. It involved an outside library again. I tried installing a newer version of gnuplot (installing the latest one by compiling the source code), but this did not resolve the issue. All in all, over an hour was spent on it, first assuming that I was coding wrongly and later realising that

 FEW DAYS ago I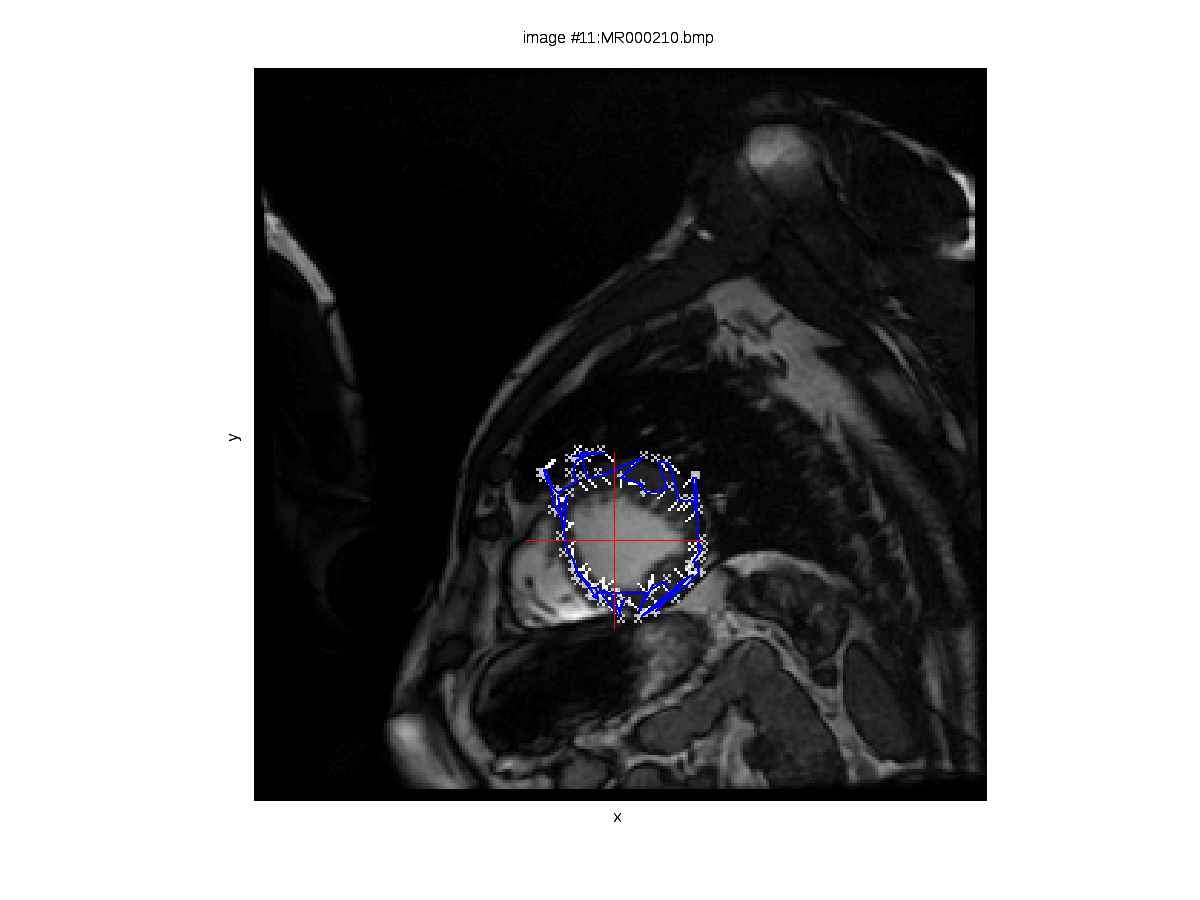
 hown here are two images derived from experiments out of which there are also videos. The set of cardiac images contains 340 images, divided into 17 groups of 20 images belonging to each. A group of 20 consecutive images represents one slice imaged throughout one cardiac cycle. This means that from the 2nd and 4th slides — images 21 and 61 respectively for example — the signal is approximately correspondent and thus can be compared. A series of experiments was performed in turn, dealing with each slice in isolation and learning how our algorithm copes with the complicated task of tracking the heart’s walls without a priori knowledge such as a model of the heart, for example (a model whose parameter values can be optimised over, for a good fit to be eventually found). We are interested in the rotation of the heart at the different vertical levels, particularly because we expect to see clockwise and counterclockwise movements throughout the cycle, depending on the slice (the heart squeezes blood by moving in different — almost opposite — directions).
