


Monday, January 3rd, 2011, 6:55 am
Ginput in Octave
 Filed under:
 ESTERDAY I encountered my first major setback in Octave for Kubuntu. It was a bug, not a missing feature. It involved an outside library again. I tried installing a newer version of gnuplot (installing the latest one by compiling the source code), but this did not resolve the issue. All in all, over an hour was spent on it, first assuming that I was coding wrongly and later realising that the issue was upstream (there are many more threads like this and they dominate the discussion on the matter). Applying the patch manually would only be a short-term solution as it was already submitted for inclusion in future releases, so for the time being, where this function is needed, I will reluctantly be testing the code under MATLAB (for which I have an academic licence that everyone gets whether they want to or not). It was rather depressing to use MATLAB for a few hours yesterday. Compatibility will be assured again when the little issue (fixable with just a line or a few) is addressed also in the binaries offered by GNU/Linux distributions. Apart from that I’m having Fedora-Octave-ImageMagick compatibility issues [1, 2], which help not at all.
My overall experience with Octave is pleasant and it remains by far the primary choice for image analysis. But for others who insist on using MATLAB I must ensure cross-compatibility, thus the following (under Fedora):

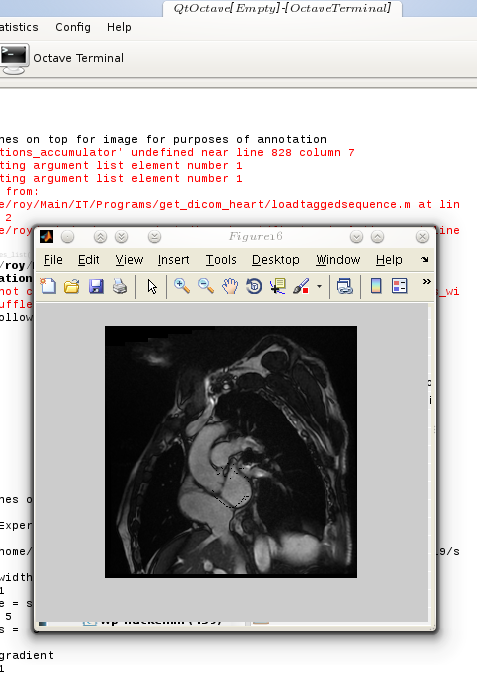
The image shows the interface which now precedes the tracking phase. Points can be placed by the user with text guidance in the console. The interfaces were also improved to separate between rectangular, circular, and manual placements.
Here is an example image without the interface.



 We hope you will join us for future shows and
 FEW DAYS ago I
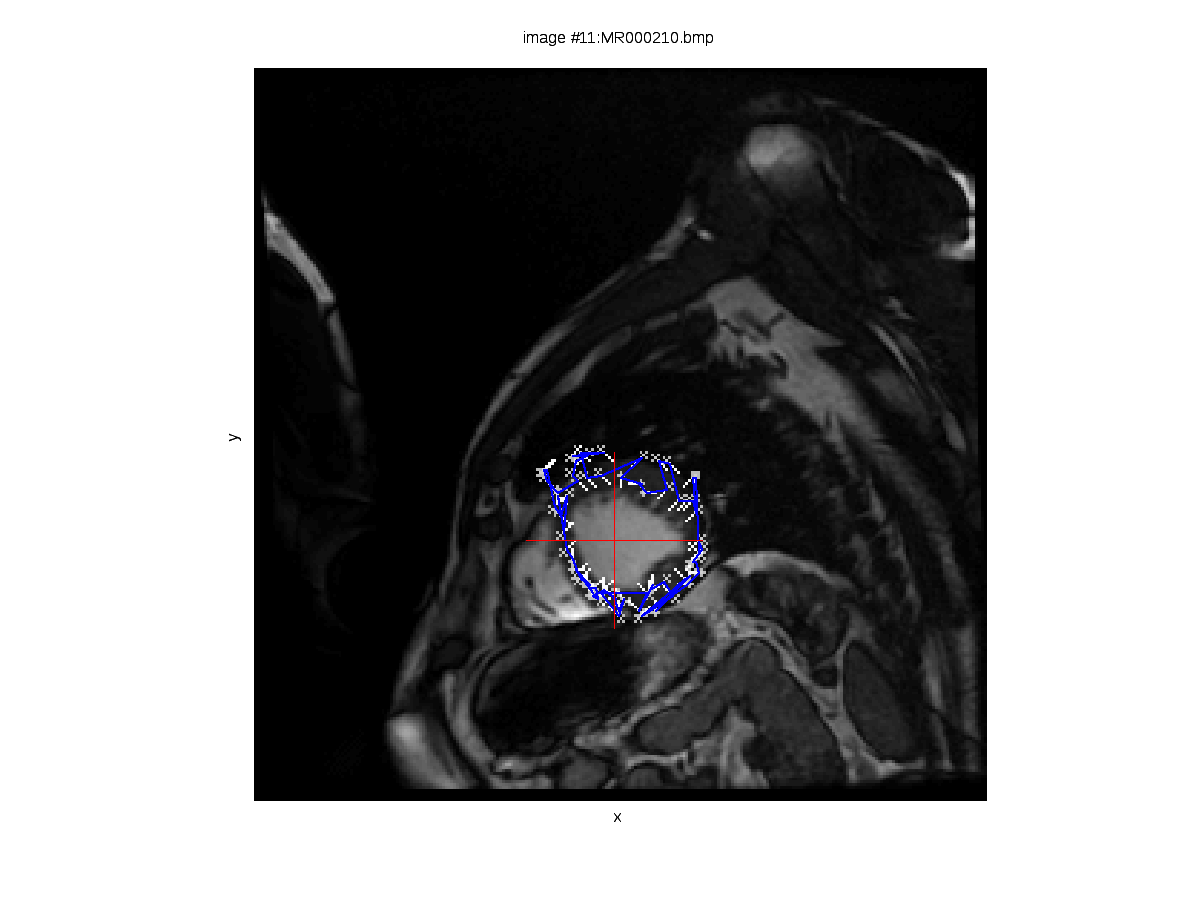
 hown here are two images derived from experiments out of which there are also videos. The set of cardiac images contains 340 images, divided into 17 groups of 20 images belonging to each. A group of 20 consecutive images represents one slice imaged throughout one cardiac cycle. This means that from the 2nd and 4th slides — images 21 and 61 respectively for example — the signal is approximately correspondent and thus can be compared. A series of experiments was performed in turn, dealing with each slice in isolation and learning how our algorithm copes with the complicated task of tracking the heart’s walls without a priori knowledge such as a model of the heart, for example (a model whose parameter values can be optimised over, for a good fit to be eventually found). We are interested in the rotation of the heart at the different vertical levels, particularly because we expect to see clockwise and counterclockwise movements throughout the cycle, depending on the slice (the heart squeezes blood by moving in different — almost opposite — directions).


 or the sake of cross-application/framework compatibility, one occasionally needs to alter code until it works everywhere, without the need to keep two (or more) separate codebases. This situation is far from ideal, but then again, not everything works like Java. When colleagues use a different platform and occasionally prefer proprietary software it is only fair to do some extra work catering for it.
 HIS fourth video in tonight’s series looks more closely at some of the different components of QtOctave.
 ITHOUT preparation I’ve just created another video that can hopefully introduce new users to QtOctave, which is an excellent program.